Bug #2267
closedHTTP traffic is detected only if async-oneside is enabled
Description
Hello.
I am not sure whether it's a bug or there's something wrong with our testbed, but we've encountered a weird behavior of suricata 4.0.1.
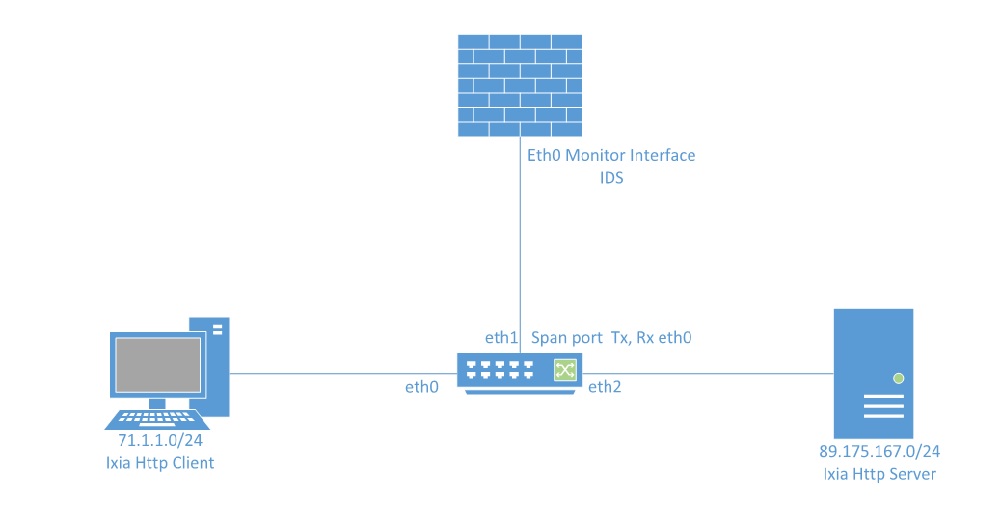
Our testbed utilizes IXIA as both HTTP client and server. Client and server are in different subnets and communicate via gateway with a SPAN port (see testbed.jpg). Suricata is almost default (suricata.yaml is attached), runs in monitoring mode (either PCAP or af-packet) and uses only one signature: "alert http any any -> any any (msg:"Do not read gossip during work"; classtype:policy-violation; sid:1; rev:1; priority:2;)". However, if we run suricata during IXIA test, only TCP streams are detected:
------------------------------------------------------------------------------------
Date: 11/10/2017 -- 14:44:29 (uptime: 0d, 00h 00m 01s)
------------------------------------------------------------------------------------
Counter | TM Name | Value
------------------------------------------------------------------------------------
decoder.pkts | Total | 5624
decoder.bytes | Total | 3153469
decoder.ipv4 | Total | 5618
decoder.ethernet | Total | 5624
decoder.tcp | Total | 5618
decoder.vlan | Total | 3016
decoder.avg_pkt_size | Total | 560
decoder.max_pkt_size | Total | 1518
flow.tcp | Total | 458
tcp.sessions | Total | 229
tcp.syn | Total | 229
tcp.synack | Total | 229
flow.spare | Total | 10000
flow_mgr.flows_checked | Total | 85
flow_mgr.flows_notimeout | Total | 85
flow_mgr.rows_checked | Total | 65536
flow_mgr.rows_skipped | Total | 65452
flow_mgr.rows_maxlen | Total | 2
tcp.memuse | Total | 1146880
tcp.reassembly_memuse | Total | 163840
flow.memuse | Total | 7206208
As a result, no alerts are triggered. But if we change async-oneside to 'true', suricata finds HTTP and triggers alerts:
------------------------------------------------------------------------------------
Date: 11/10/2017 -- 14:37:30 (uptime: 0d, 00h 00m 01s)
------------------------------------------------------------------------------------
Counter | TM Name | Value
------------------------------------------------------------------------------------
decoder.pkts | Total | 5624
decoder.bytes | Total | 3153469
decoder.ipv4 | Total | 5618
decoder.ethernet | Total | 5624
decoder.tcp | Total | 5618
decoder.vlan | Total | 3016
decoder.avg_pkt_size | Total | 560
decoder.max_pkt_size | Total | 1518
flow.tcp | Total | 458
tcp.sessions | Total | 458
tcp.syn | Total | 229
tcp.synack | Total | 229
detect.alert | Total | 680
app_layer.tx.http | Total | 256
app_layer.flow.failed_tcp | Total | 219
flow.spare | Total | 10000
flow_mgr.flows_checked | Total | 36
flow_mgr.flows_notimeout | Total | 36
flow_mgr.rows_checked | Total | 65536
flow_mgr.rows_skipped | Total | 65500
flow_mgr.rows_maxlen | Total | 1
tcp.memuse | Total | 1146880
tcp.reassembly_memuse | Total | 163840
flow.memuse | Total | 7206208
A sample PCAP file is also attached. I can not understand what can go wrong - synacks match syns, no packets are dropped. Could anyone give me a hint, please?
Files
AG Updated by Alexander Gozman over 8 years ago
Probably there's something wrong with a SPAN port 'cause server-to-client packets contain VLAN tags while client-to-server ones do not.
AG Updated by Alexander Gozman over 8 years ago
- Status changed from New to Closed