Bug #1717
closedMemory leak on Suricata 3.0 with Netmap
Description
Very strange memory leak with Suricata on different kernels (3.19.3 and 4.1.16 tested) in RunModeIdsNetmapAutoFp using netmap as source. Test on high load - on about 7Gbit/s 1.2 Mpps HTTP + HTTPS traffic. Different versions of netmap is tested. The last test was on the box where Suricata 2.1beta4 + netmap worked without reboot about 180+ days.
The case is drammatical increase of memory usage after about 45 minutes after suricata start. The memory usage grows from 2Gb to 8Gb + 2-3 Gb swap within 1 minute or less.
What should I supply to understand the core of the problem?
Files
VF Updated by Vadim Fedorenko over 10 years ago
- File suricata-build-info.txt suricata-build-info.txt added
- File suricata.log suricata.log added
- File last_stat.log last_stat.log added
I've attached suricata build info, log file of suricata verbose output and stats.log during last run
VF Updated by Vadim Fedorenko over 10 years ago
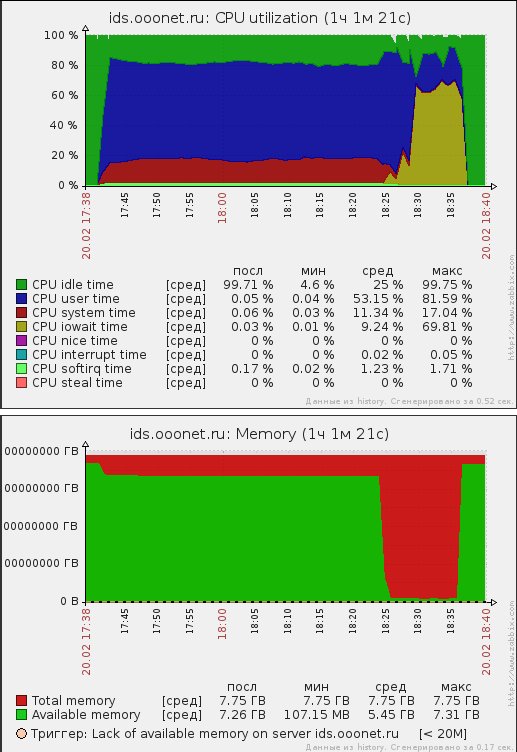
Also I've attached monitoring graphs of CPU and memory usage of host
VJ Updated by Victor Julien over 10 years ago
- Target version changed from 3.0.1RC1 to 70
Can you test 3.0 with those older kernels and/or 2.1beta4 with the current kernel to see if any of those combinations triggers the memuse issue?
VF Updated by Vadim Fedorenko over 10 years ago
As I said, I've tested 3.0 on the box with kernel 3.19.3, where 2.1beta4 worked for a 180+ days, and it crashed after 45 minutes...
Now I'm testing 2.1beta4 with the kernel 4.1.16 and the last netmap - it seems to be working for 8 hours for now.
VF Updated by Vadim Fedorenko over 10 years ago
Update to a case - the problem seems to be only with "autofp" runmode. Right now test box with suricata 3.0 + netmap is running for 20 hours long without any problem.
VJ Updated by Victor Julien over 10 years ago
- Assignee set to Aleksey Katargin
One difference between autofp and workers is that workers enables zero copy. Aleksey, any idea?
AK Updated by Aleksey Katargin over 10 years ago
Tested latest master version in netmap mode with autofp mode.
Valgrind memleak shows nothing:
[42451] 24/2/2016 -- 11:15:13 - (util-device.c:191) <Notice> (LiveDeviceListClean) -- Stats for 'eth0+': pkts: 82864, drop: 0 (0.00%), invalid chksum: 0
[42451] 24/2/2016 -- 11:15:13 - (util-device.c:191) <Notice> (LiveDeviceListClean) -- Stats for 'eth0': pkts: 147517, drop: 0 (0.00%), invalid chksum: 0
42451
42451 HEAP SUMMARY:
42451 in use at exit: 248,230 bytes in 841 blocks
42451 total heap usage: 130,497 allocs, 129,656 frees, 63,609,259 bytes allocated
42451
42451 Thread 1 Suricata-Main:
42451 48 bytes in 1 blocks are definitely lost in loss record 109 of 340
42451 at 0x4C2AD10: calloc (vg_replace_malloc.c:623)
42451 by 0x505DBEB: ? (in /usr/lib/x86_64-linux-gnu/libmagic.so.1.0.0)
42451 by 0x505E6B6: ? (in /usr/lib/x86_64-linux-gnu/libmagic.so.1.0.0)
42451 by 0x5CC058: MagicInit (util-magic.c:80)
42451 by 0x597A46: main (suricata.c:2295)
42451
42451 LEAK SUMMARY:
42451 definitely lost: 48 bytes in 1 blocks
42451 indirectly lost: 0 bytes in 2 blocks
42451 possibly lost: 0 bytes in 0 blocks
42451 still reachable: 248,182 bytes in 838 blocks
42451 suppressed: 0 bytes in 0 blocks
42451 Reachable blocks (those to which a pointer was found) are not shown.
42451 To see them, rerun with: --leak-check=full --show-leak-kinds=all
42451
42451 For counts of detected and suppressed errors, rerun with: -v
42451 Use --track-origins=yes to see where uninitialised values come from
42451 ERROR SUMMARY: 7 errors from 4 contexts (suppressed: 0 from 0)
autofp mode is really not recommended as it can't do zero-copy traffic forwarding and achieve same performance as workers mode.
memory exhaustion is a consequence of the slow packet processing
VJ Updated by Victor Julien over 10 years ago
Aleksey, I have a doubt about how autofp and netmap interact:
In ReceiveNetmapLoop, we enter a loop that pretty much starts with PacketPoolWait(). This makes sure that we have at least one packet in our local packet pool. Then, assuming there is much traffic, we loop through the rings and call NetmapRingRead for each. NetmapRingRead then loops through the packets it can read per ring and gets a Packet through PacketGetFromQueueOrAlloc for each. Note that this might lead to an allocation if the packet pool is empty.
Do you have an idea about how many packets might be processed in a single ReceiveNetmapLoop iteration? If we just wait for a single packet in the packetpool, but alloc dozens or hundreds or more packets in the NetmapRingRead then the increased memory use could be explained.
In autofp mode the NetmapRingRead may run much quicker than in workers. In workers TmThreadsSlotProcessPkt processes the full packet pipeline (so incl Detect, Outputs). In autofp it just calls Decode and then hands it off to other threads.
AK Updated by Aleksey Katargin over 10 years ago
Do you have an idea about how many packets might be processed in a single ReceiveNetmapLoop iteration?
ring_size*ring_count/thread_count
default ring_size is 512 for ixgbe and 256 for igb for example.
ring_count for 1 to 16 depending on cpu cores count.
In autofp mode the NetmapRingRead may run much quicker than in workers.
Yes, it makes a copy of packet and queue it to other threads, but if packets will come too fast - packet queue will growth instantly!
VJ Updated by Victor Julien over 10 years ago
I wonder if there would be side effect if we'd have something like PacketPoolWaitForN(avail) at the start of NetmapRingRead(). This would block the thread until 'avail' number of packets are in the packet pool.
AK Updated by Aleksey Katargin over 10 years ago
worth a try :)
VF Updated by Vadim Fedorenko over 10 years ago
I have to say that in my scenario I used rings size of 4096 - the maximum allowed for ixgbe driver. To solve the issue with netmap memory allocation failure I've used ring_size=66000 parameter on netmap module loading. ring_count=thread_count in my scenario
VJ Updated by Victor Julien over 10 years ago
- Status changed from New to Assigned
Aleksey, are you working on this one? Thanks!
AK Updated by Aleksey Katargin over 10 years ago
I am busy right now. Will make a try ASAP! Thanks!
VJ Updated by Victor Julien over 10 years ago
- Status changed from Assigned to Closed
- Target version changed from 70 to 3.0.1RC1