Support #3132
closedsuricata can't capture all the packets
Description
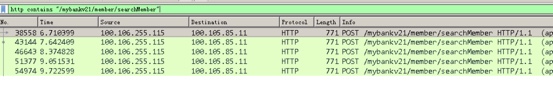
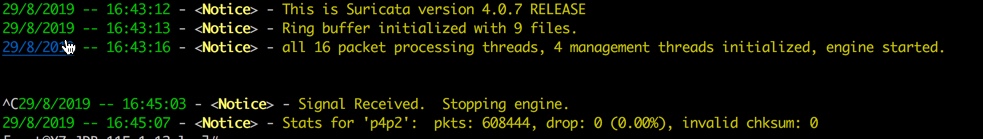
i try lots of tests to capture http packets use suricata, every time when i stop the capture, it tells me no packets drops, but actually what i send data it didn't capture all
so i try another test, i use tcpdump to capture the data and start suricata at the same time , i sent 5data tcpdump capture all but suricata capture 0 and when i stop , it tells me 0 packet drop.
i've no idea about this please give some helps
other tips:
1. i use pfring, actually the traffic is very small , 3000-5000pps
2. i test only 1 rule
Files
VJ Updated by Victor Julien almost 7 years ago
- Priority changed from High to Normal
- Target version deleted (
4.1.5)
YL Updated by yg lu almost 7 years ago
btw:
i have tried 4.1.x and 4.0.x versions and i have tried every runmode (pfring、pcap、afpacket) all can't works well for me
AH Updated by Andreas Herz almost 7 years ago
- Status changed from New to Feedback
- Assignee set to yg lu
- Target version set to Support
Can you be more verbose about your setup, how you run suricata, configuration etc.?
YL Updated by yg lu almost 7 years ago
here is my conf
--------------
%YAML 1.1
---
- Suricata configuration file. In addition to the comments describing all
- options in this file, full documentation can be found at:
- https://redmine.openinfosecfoundation.org/projects/suricata/wiki/Suricatayaml
- Step 1: inform Suricata about your network ##
vars:
# more specifc is better for alert accuracy and performance
address-groups:
#HOME_NET: "[192.168.0.0/16,10.0.0.0/8,172.16.0.0/12]"
#HOME_NET: "[192.168.0.0/16]"
#HOME_NET: "[10.0.0.0/8]"
#HOME_NET: "[172.16.0.0/12]"
HOME_NET: "any"
#EXTERNAL_NET: "!$HOME_NET"
    EXTERNAL_NET: "any"
HTTP_SERVERS: "$HOME_NET"
SMTP_SERVERS: "$HOME_NET"
SQL_SERVERS: "$HOME_NET"
DNS_SERVERS: "$HOME_NET"
TELNET_SERVERS: "$HOME_NET"
AIM_SERVERS: "$EXTERNAL_NET"
DNP3_SERVER: "$HOME_NET"
DNP3_CLIENT: "$HOME_NET"
MODBUS_CLIENT: "$HOME_NET"
MODBUS_SERVER: "$HOME_NET"
ENIP_CLIENT: "$HOME_NET"
ENIP_SERVER: "$HOME_NET"port-groups:
HTTP_PORTS: "80"
SHELLCODE_PORTS: "!80"
ORACLE_PORTS: 1521
SSH_PORTS: 22
DNP3_PORTS: 20000
MODBUS_PORTS: 502
FILE_DATA_PORTS: "[$HTTP_PORTS,110,143]"
FTP_PORTS: 21- Step 2: select the rules to enable or disable ##
rule-files: # - botcc.portgrouped.rules
- testcap.rules
- - emerging-activex.rules
- - decoder-events.rules # available in suricata sources under rules dir
- - stream-events.rules # available in suricata sources under rules dir
- - modbus-events.rules # available in suricata sources under rules dir
- - app-layer-events.rules # available in suricata sources under rules dir
- - dnp3-events.rules # available in suricata sources under rules dir
- - ntp-events.rules # available in suricata sources under rules dir
reference-config-file: /usr/local/suricata4/etc/suricata/reference.config
- threshold-file: /usr/local/suricata4/etc/suricata/threshold.config
- Step 3: select outputs to enable ##
- The default logging directory. Any log or output file will be
- placed here if its not specified with a full path name. This can be
- overridden with the -l command line parameter.
default-log-dir: /data/public/suricata4.0.5/log
- global stats configuration
stats:
enabled: yes # The interval field (in seconds) controls at what interval # the loggers are invoked.
interval: 8
- Configure the type of alert (and other) logging you would like.
outputs: # a line based alerts log similar to Snort's fast.log
- fast:
enabled: no
filename: fast.log
append: yes
#filetype: regular # 'regular', 'unix_stream' or 'unix_dgram'- Extensible Event Format (nicknamed EVE) event log in JSON format
- eve-log:
enabled: yes # filetype: redis #regular|syslog|unix_dgram|unix_stream|redis
filetype: regular #regular|syslog|unix_dgram|unix_stream|redis
filename: eve-httpall.json
#prefix: "@cee: " # prefix to prepend to each log entry # the following are valid when type: syslog above
#identity: "suricata"
#facility: local5
#level: Info ## possible levels: Emergency, Alert, Critical, ## Error, Warning, Notice, Info, Debug
redis:
server: 127.0.0.1
port: 6379 # async: true ## if redis replies are read asynchronously
mode: list ## possible values: list|lpush (default), rpush, channel|publish # ## lpush and rpush are using a Redis list. "list" is an alias for lpush # ## publish is using a Redis channel. "channel" is an alias for publish
key: suricata ## key or channel to use (default to suricata) # Redis pipelining set up. This will enable to only do a query every # 'batch-size' events. This should lower the latency induced by network # connection at the cost of some memory. There is no flushing implemented # so this setting as to be reserved to high traffic suricata.
pipelining:
enabled: yes ## set enable to yes to enable query pipelining
batch-size: 100 ## number of entry to keep in buffer
types:
- alert: # payload: yes # enable dumping payload in Base64 # payload-buffer-size: 10240kb # max size of payload buffer to output in eve-log # payload-printable: yes # enable dumping payload in printable (lossy) format # packet: yes # enable dumping of packet (without stream segments)
http-body: yes # enable dumping of http body in Base64 # http-body-printable: yes # enable dumping of http body in printable format
metadata: yes # add L7/applayer fields, flowbit and other vars to the alert- Enable the logging of tagged packets for rules using the
# "tag" keyword.
tagged-packets: yes - alerts: yes # log alerts that caused drops
- flows: all # start or all: 'start' logs only a single drop
- # per flow direction. All logs each dropped pkt.
- - smtp:
#extended: yes # enable this for extended logging information # this includes: bcc, message-id, subject, x_mailer, user-agent # custom fields logging from the list: # reply-to, bcc, message-id, subject, x-mailer, user-agent, received, # x-originating-ip, in-reply-to, references, importance, priority, # sensitivity, organization, content-md5, date
#custom: [received, x-mailer, x-originating-ip, relays, reply-to, bcc] # output md5 of fields: body, subject # for the body you need to set app-layer.protocols.smtp.mime.body-md5 # to yes
#md5: [body, subject]
- HTTP X-Forwarded-For support by adding an extra field or overwriting
- the source or destination IP address (depending on flow direction)
- with the one reported in the X-Forwarded-For HTTP header. This is
- helpful when reviewing alerts for traffic that is being reverse
- or forward proxied.
xff:
enabled: yes # Two operation modes are available, "extra-data" and "overwrite".
mode: extra-data # Two proxy deployments are supported, "reverse" and "forward". In # a "reverse" deployment the IP address used is the last one, in a # "forward" deployment the first IP address is used.
deployment: forward # Header name where the actual IP address will be reported, if more # than one IP address is present, the last IP address will be the # one taken into consideration.
header: X-Forwarded-For
#- http:
#extended: no # enable this for extended logging information - custom allows additional http fields to be included in eve-log
- the example below adds three additional fields when uncommented
#custom: [Accept-Encoding, Accept-Language, Authorization]
#- dns: - control logging of queries and answers
- default yes, no to disable
#query: no # enable logging of DNS queries
#answer: no # enable logging of DNS answers - control which RR types are logged
- all enabled if custom not specified
#custom: [a, aaaa, cname, mx, ns, ptr, txt]
#- tls:
#extended: no # enable this for extended logging information - output TLS transaction where the session is resumed using a
- session id
#session-resumption: no - custom allows to control which tls fields that are included
- in eve-log
#custom: [subject, issuer, session_resumed, serial, fingerprint, sni, version, not_before, not_after, certificate, chain]
#- files:
#force-magic: no # force logging magic on all logged files - force logging of checksums, available hash functions are md5,
- sha1 and sha256
#force-hash: [md5]
#- drop:
- Enable the logging of tagged packets for rules using the
# "tag" keyword.
- dnp3
#- nfs- - ssh
#- stats: - totals: no # stats for all threads merged together
- threads: no # per thread stats
- deltas: no # include delta values
- bi-directional flows
- - flow
- uni-directional flows
#- netflow - Vars log flowbits and other packet and flow vars
#- vars
- - ssh
- alert output for use with Barnyard2
- unified2-alert:
enabled: no
filename: unified2.alert- File size limit. Can be specified in kb, mb, gb. Just a number
- is parsed as bytes.
#limit: 32mb
- By default unified2 log files have the file creation time (in
- unix epoch format) appended to the filename. Set this to yes to
- disable this behaviour.
#nostamp: no
- Sensor ID field of unified2 alerts.
#sensor-id: 0
- Include payload of packets related to alerts. Defaults to true, set to
- false if payload is not required.
#payload: yes
- HTTP X-Forwarded-For support by adding the unified2 extra header or
- overwriting the source or destination IP address (depending on flow
- direction) with the one reported in the X-Forwarded-For HTTP header.
- This is helpful when reviewing alerts for traffic that is being reverse
- or forward proxied.
xff:
enabled: no # Two operation modes are available, "extra-data" and "overwrite". Note # that in the "overwrite" mode, if the reported IP address in the HTTP # X-Forwarded-For header is of a different version of the packet # received, it will fall-back to "extra-data" mode.
mode: extra-data # Two proxy deployments are supported, "reverse" and "forward". In # a "reverse" deployment the IP address used is the last one, in a # "forward" deployment the first IP address is used.
deployment: reverse # Header name where the actual IP address will be reported, if more # than one IP address is present, the last IP address will be the # one taken into consideration.
header: X-Forwarded-For
- a line based log of HTTP requests (no alerts)
- http-log:
enabled: no
filename: http.log
append: yes
#extended: yes # enable this for extended logging information
#custom: yes # enabled the custom logging format (defined by customformat)
#customformat: "%{%D-%H:%M:%S}t.%z %{X-Forwarded-For}i %H %m %h %u %s %B %a:%p -> %A:%P"
#filetype: regular # 'regular', 'unix_stream' or 'unix_dgram'
- a line based log of TLS handshake parameters (no alerts)
- tls-log:
enabled: no # Log TLS connections.
filename: tls.log # File to store TLS logs.
append: yes
#extended: yes # Log extended information like fingerprint
#custom: yes # enabled the custom logging format (defined by customformat)
#customformat: "%{%D-%H:%M:%S}t.%z %a:%p -> %A:%P %v %n %d %D"
#filetype: regular # 'regular', 'unix_stream' or 'unix_dgram' # output TLS transaction where the session is resumed using a # session id
#session-resumption: no
- output module to store certificates chain to disk
- tls-store:
enabled: no
#certs-log-dir: certs # directory to store the certificates files
- a line based log of DNS requests and/or replies (no alerts)
- dns-log:
enabled: no
filename: dns.log
append: yes
#filetype: regular # 'regular', 'unix_stream' or 'unix_dgram'
- Packet log... log packets in pcap format. 3 modes of operation: "normal"
- "multi" and "sguil". #
- In normal mode a pcap file "filename" is created in the default-log-dir,
- or are as specified by "dir".
- In multi mode, a file is created per thread. This will perform much
- better, but will create multiple files where 'normal' would create one.
- In multi mode the filename takes a few special variables:
- - %n -- thread number
- - %i -- thread id
- - %t -- timestamp (secs or secs.usecs based on 'ts-format'
- E.g. filename: pcap.%n.%t #
- Note that it's possible to use directories, but the directories are not
- created by Suricata. E.g. filename: pcaps/%n/log.%s will log into the
- per thread directory. #
- Also note that the limit and max-files settings are enforced per thread.
- So the size limit when using 8 threads with 1000mb files and 2000 files
- is: 8*1000*2000 ~ 16TiB. #
- In Sguil mode "dir" indicates the base directory. In this base dir the
- pcaps are created in th directory structure Sguil expects: #
- $sguil-base-dir/YYYY-MM-DD/$filename.<timestamp> #
- By default all packets are logged except:
- - TCP streams beyond stream.reassembly.depth
- - encrypted streams after the key exchange
#
- pcap-log:
enabled: yes
filename: log.pcap- File size limit. Can be specified in kb, mb, gb. Just a number
- is parsed as bytes.
limit: 1000mb
- If set to a value will enable ring buffer mode. Will keep Maximum of "max-files" of size "limit"
max-files: 2000
mode: normal # normal, multi or sguil.
- Directory to place pcap files. If not provided the default log
- directory will be used. Required for "sguil" mode.
#dir: /nsm_data/
#ts-format: usec # sec or usec second format (default) is filename.sec usec is filename.sec.usec
use-stream-depth: no #If set to "yes" packets seen after reaching stream inspection depth are ignored. "no" logs all packets
honor-pass-rules: no # If set to "yes", flows in which a pass rule matched will stopped being logged.
- a full alerts log containing much information for signature writers
- or for investigating suspected false positives.
- alert-debug:
enabled: no
filename: alert-debug.log
append: yes
#filetype: regular # 'regular', 'unix_stream' or 'unix_dgram'
- alert output to prelude (http://www.prelude-technologies.com/) only
- available if Suricata has been compiled with --enable-prelude
- alert-prelude:
enabled: no
profile: suricata
log-packet-content: no
log-packet-header: yes
- Stats.log contains data from various counters of the suricata engine.
- stats:
enabled: yes
filename: stats.log
append: yes # append to file (yes) or overwrite it (no)
totals: yes # stats for all threads merged together
threads: no # per thread stats
#null-values: yes # print counters that have value 0
- a line based alerts log similar to fast.log into syslog
- syslog:
enabled: no # reported identity to syslog. If ommited the program name (usually # suricata) will be used.
#identity: "suricata"
facility: local5
#level: Info ## possible levels: Emergency, Alert, Critical, ## Error, Warning, Notice, Info, Debug
- a line based information for dropped packets in IPS mode
- drop:
enabled: no
filename: drop.log
append: yes
#filetype: regular # 'regular', 'unix_stream' or 'unix_dgram'
- output module to store extracted files to disk #
- The files are stored to the log-dir in a format "file.<id>" where <id> is
- an incrementing number starting at 1. For each file "file.<id>" a meta
- file "file.<id>.meta" is created. #
- File extraction depends on a lot of things to be fully done:
- - file-store stream-depth. For optimal results, set this to 0 (unlimited)
- - http request / response body sizes. Again set to 0 for optimal results.
- - rules that contain the "filestore" keyword.
- file-store:
enabled: no # set to yes to enable
log-dir: files # directory to store the files
force-magic: no # force logging magic on all stored files # force logging of checksums, available hash functions are md5, # sha1 and sha256
#force-hash: [md5]
force-filestore: no # force storing of all files # override global stream-depth for sessions in which we want to # perform file extraction. Set to 0 for unlimited.
#stream-depth: 0
#waldo: file.waldo # waldo file to store the file_id across runs # uncomment to disable meta file writing
#write-meta: no # uncomment the following variable to define how many files can # remain open for filestore by Suricata. Default value is 0 which # means files get closed after each write
#max-open-files: 1000
- output module to log files tracked in a easily parsable json format
- file-log:
enabled: no
filename: files-json.log
append: yes
#filetype: regular # 'regular', 'unix_stream' or 'unix_dgram' force-magic: no # force logging magic on all logged files- force logging of checksums, available hash functions are md5,
- sha1 and sha256
#force-hash: [md5]
- Log TCP data after stream normalization
- 2 types: file or dir. File logs into a single logfile. Dir creates
- 2 files per TCP session and stores the raw TCP data into them.
- Using 'both' will enable both file and dir modes. #
- Note: limited by stream.depth
- tcp-data:
enabled: no
type: file
filename: tcp-data.log
- Log HTTP body data after normalization, dechunking and unzipping.
- 2 types: file or dir. File logs into a single logfile. Dir creates
- 2 files per HTTP session and stores the normalized data into them.
- Using 'both' will enable both file and dir modes. #
- Note: limited by the body limit settings
- http-body-data:
enabled: no
type: file
filename: http-data.log
- Lua Output Support - execute lua script to generate alert and event
- output.
- Documented at:
- https://redmine.openinfosecfoundation.org/projects/suricata/wiki/Lua_Output
- lua:
enabled: no
#scripts-dir: /etc/suricata/lua-output/
scripts: # - script1.lua
- Extensible Event Format (nicknamed EVE) event log in JSON format
- Logging configuration. This is not about logging IDS alerts/events, but
- output about what Suricata is doing, like startup messages, errors, etc.
logging: # The default log level, can be overridden in an output section. # Note that debug level logging will only be emitted if Suricata was # compiled with the --enable-debug configure option. # # This value is overriden by the SC_LOG_LEVEL env var.
default-log-level: notice- The default output format. Optional parameter, should default to
- something reasonable if not provided. Can be overriden in an
- output section. You can leave this out to get the default. #
- This value is overriden by the SC_LOG_FORMAT env var.
#default-log-format: "[%i] %t - (%f:%l) <%d> (%n) -- "
- A regex to filter output. Can be overridden in an output section.
- Defaults to empty (no filter). #
- This value is overriden by the SC_LOG_OP_FILTER env var.
default-output-filter:
- Define your logging outputs. If none are defined, or they are all
- disabled you will get the default - console output.
outputs:
- console:
enabled: yes # type: json
- file:
enabled: yes
level: info
filename: suricata.log # type: json
- syslog:
enabled: no
facility: local5
format: "[%i] <%d> -- " # type: json
- Step 4: configure common capture settings ##
- See "Advanced Capture Options" below for more options, including NETMAP
- and PF_RING. ##
- Linux high speed capture support
af-packet:
- interface: p4p2 # Number of receive threads. "auto" uses the number of cores
#threads: auto # Default clusterid. AF_PACKET will load balance packets based on flow.
cluster-id: 97 # Default AF_PACKET cluster type. AF_PACKET can load balance per flow or per hash. # This is only supported for Linux kernel > 3.1 # possible value are: # * cluster_round_robin: round robin load balancing # * cluster_flow: all packets of a given flow are send to the same socket # * cluster_cpu: all packets treated in kernel by a CPU are send to the same socket # * cluster_qm: all packets linked by network card to a RSS queue are sent to the same # socket. Requires at least Linux 3.14. # * cluster_random: packets are sent randomly to sockets but with an equipartition. # Requires at least Linux 3.14. # * cluster_rollover: kernel rotates between sockets filling each socket before moving # to the next. Requires at least Linux 3.10. # Recommended modes are cluster_flow on most boxes and cluster_cpu or cluster_qm on system # with capture card using RSS (require cpu affinity tuning and system irq tuning)
cluster-type: cluster_flow # In some fragmentation case, the hash can not be computed. If "defrag" is set # to yes, the kernel will do the needed defragmentation before sending the packets.
defrag: yes # After Linux kernel 3.10 it is possible to activate the rollover option: if a socket is # full then kernel will send the packet on the next socket with room available. This option # can minimize packet drop and increase the treated bandwidth on single intensive flow.
#rollover: yes # To use the ring feature of AF_PACKET, set 'use-mmap' to yes
use-mmap: no # Lock memory map to avoid it goes to swap. Be careful that over suscribing could lock # your system
#mmap-locked: yes # Use tpacket_v3 capture mode, only active if use-mmap is true # Don't use it in IPS or TAP mode as it causes severe latency
#tpacket-v3: yes # Ring size will be computed with respect to max_pending_packets and number # of threads. You can set manually the ring size in number of packets by setting # the following value. If you are using flow cluster-type and have really network # intensive single-flow you could want to set the ring-size independently of the number # of threads:
ring-size: 204800 # Block size is used by tpacket_v3 only. It should set to a value high enough to contain # a decent number of packets. Size is in bytes so please consider your MTU. It should be # a power of 2 and it must be multiple of page size (usually 4096).
#block-size: 32768 # tpacket_v3 block timeout: an open block is passed to userspace if it is not # filled after block-timeout milliseconds.
#block-timeout: 10 # On busy system, this could help to set it to yes to recover from a packet drop # phase. This will result in some packets (at max a ring flush) being non treated.
#use-emergency-flush: yes # recv buffer size, increase value could improve performance
buffer-size: 327680 # Set to yes to disable promiscuous mode # disable-promisc: no # Choose checksum verification mode for the interface. At the moment # of the capture, some packets may be with an invalid checksum due to # offloading to the network card of the checksum computation. # Possible values are: # - kernel: use indication sent by kernel for each packet (default) # - yes: checksum validation is forced # - no: checksum validation is disabled # - auto: suricata uses a statistical approach to detect when # checksum off-loading is used. # Warning: 'checksum-validation' must be set to yes to have any validation
#checksum-checks: kernel # BPF filter to apply to this interface. The pcap filter syntax apply here.
#bpf-filter: port 80 or udp # You can use the following variables to activate AF_PACKET tap or IPS mode. # If copy-mode is set to ips or tap, the traffic coming to the current # interface will be copied to the copy-iface interface. If 'tap' is set, the # copy is complete. If 'ips' is set, the packet matching a 'drop' action # will not be copied.
#copy-mode: ips
#copy-iface: eth1- Put default values here. These will be used for an interface that is not
- in the list above.
- interface: default
#threads: auto
#use-mmap: no
#rollover: yes
#tpacket-v3: yes
- Cross platform libpcap capture support
pcap:
- interface: eth0 # On Linux, pcap will try to use mmaped capture and will use buffer-size # as total of memory used by the ring. So set this to something bigger # than 1% of your bandwidth.
#buffer-size: 16777216
#bpf-filter: "tcp and port 25" # Choose checksum verification mode for the interface. At the moment # of the capture, some packets may be with an invalid checksum due to # offloading to the network card of the checksum computation. # Possible values are: # - yes: checksum validation is forced # - no: checksum validation is disabled # - auto: suricata uses a statistical approach to detect when # checksum off-loading is used. (default) # Warning: 'checksum-validation' must be set to yes to have any validation
#checksum-checks: auto # With some accelerator cards using a modified libpcap (like myricom), you # may want to have the same number of capture threads as the number of capture # rings. In this case, set up the threads variable to N to start N threads # listening on the same interface.
#threads: 16 # set to no to disable promiscuous mode:
#promisc: no # set snaplen, if not set it defaults to MTU if MTU can be known # via ioctl call and to full capture if not.
#snaplen: 1518 # Put default values here
- interface: default
#checksum-checks: auto
- Settings for reading pcap files
pcap-file: # Possible values are: # - yes: checksum validation is forced # - no: checksum validation is disabled # - auto: suricata uses a statistical approach to detect when # checksum off-loading is used. (default) # Warning: 'checksum-validation' must be set to yes to have checksum tested
checksum-checks: auto
- See "Advanced Capture Options" below for more options, including NETMAP
- and PF_RING.
- Step 5: App Layer Protocol Configuration ##
- Configure the app-layer parsers. The protocols section details each
- protocol. #
- The option "enabled" takes 3 values - "yes", "no", "detection-only".
- "yes" enables both detection and the parser, "no" disables both, and
- "detection-only" enables protocol detection only (parser disabled).
app-layer:
protocols:
tls:
enabled: no
detection-ports:
dp: 443- Completely stop processing TLS/SSL session after the handshake
# completed. If bypass is enabled this will also trigger flow
# bypass. If disabled (the default), TLS/SSL session is still
# tracked for Heartbleed and other anomalies.
#no-reassemble: yes
dcerpc:
enabled: no
ftp:
enabled: no
ssh:
enabled: no
smtp:
enabled: no # Configure SMTP-MIME Decoder
mime: # Decode MIME messages from SMTP transactions # (may be resource intensive) # This field supercedes all others because it turns the entire # process on or off
decode-mime: yes - smb2 detection is disabled internally inside the engine.
#smb2: - enabled: yes
- Note: NFS parser depends on Rust support: pass --enable-rust
- to configure.
nfs:
enabled: no
dns:
enabled: no # memcaps. Globally and per flow/state.
#global-memcap: 16mb
#state-memcap: 512kb
- How many unreplied DNS requests are considered a flood.
- If the limit is reached, app-layer-event:dns.flooded; will match.
#request-flood: 500
enabled: no
detection-ports:
dp: 53
udp:
enabled: no
detection-ports:
dp: 53
http:
enabled: yes- memcap: 64mb
- default-config: Used when no server-config matches
- personality: List of personalities used by default
- request-body-limit: Limit reassembly of request body for inspection
- by http_client_body & pcre /P option.
- response-body-limit: Limit reassembly of response body for inspection
- by file_data, http_server_body & pcre /Q option.
- double-decode-path: Double decode path section of the URI
- double-decode-query: Double decode query section of the URI
- response-body-decompress-layer-limit:
- Limit to how many layers of compression will be
- decompressed. Defaults to 2. #
- server-config: List of server configurations to use if address matches
- address: List of ip addresses or networks for this block
- personalitiy: List of personalities used by this block
- request-body-limit: Limit reassembly of request body for inspection
- by http_client_body & pcre /P option.
- response-body-limit: Limit reassembly of response body for inspection
- by file_data, http_server_body & pcre /Q option.
- double-decode-path: Double decode path section of the URI
- double-decode-query: Double decode query section of the URI #
- uri-include-all: Include all parts of the URI. By default the
- 'scheme', username/password, hostname and port
- are excluded. Setting this option to true adds
- all of them to the normalized uri as inspected
- by http_uri, urilen, pcre with /U and the other
- keywords that inspect the normalized uri.
- Note that this does not affect http_raw_uri.
- Also, note that including all was the default in
- 1.4 and 2.0beta1. #
- meta-field-limit: Hard size limit for request and response size
- limits. Applies to request line and headers,
- response line and headers. Does not apply to
- request or response bodies. Default is 18k.
- If this limit is reached an event is raised. #
- Currently Available Personalities:
- Minimal, Generic, IDS (default), IIS_4_0, IIS_5_0, IIS_5_1, IIS_6_0,
- IIS_7_0, IIS_7_5, Apache_2
libhtp:
default-config:
personality: IDS- Can be specified in kb, mb, gb. Just a number indicates
# it's in bytes.
request-body-limit: 100kb
response-body-limit: 100kb
- inspection limits
request-body-minimal-inspect-size: 32kb
request-body-inspect-window: 4kb
response-body-minimal-inspect-size: 40kb
response-body-inspect-window: 16kb
- response body decompression (0 disables)
response-body-decompress-layer-limit: 2
- auto will use http-body-inline mode in IPS mode, yes or no set it statically
http-body-inline: auto
- Take a random value for inspection sizes around the specified value.
- This lower the risk of some evasion technics but could lead
- detection change between runs. It is set to 'yes' by default.
#randomize-inspection-sizes: yes - If randomize-inspection-sizes is active, the value of various
- inspection size will be choosen in the [1 - range%, 1 + range%]
- range
- Default value of randomize-inspection-range is 10.
#randomize-inspection-range: 10
- decoding
double-decode-path: no
double-decode-query: no
server-config:
- Can be specified in kb, mb, gb. Just a number indicates
# it's in bytes.
- apache:
- address: [192.168.1.0/24, 127.0.0.0/8, "::1"]
- personality: Apache_2
- # Can be specified in kb, mb, gb. Just a number indicates
- # it's in bytes.
- request-body-limit: 4096
- response-body-limit: 4096
- double-decode-path: no
- double-decode-query: no
- iis7:
- address:
- - 192.168.0.0/24
- - 192.168.10.0/24
- personality: IIS_7_0
- # Can be specified in kb, mb, gb. Just a number indicates
- # it's in bytes.
- request-body-limit: 4096
- response-body-limit: 4096
- double-decode-path: no
- double-decode-query: no
- Note: Modbus probe parser is minimalist due to the poor significant field
- Only Modbus message length (greater than Modbus header length)
- And Protocol ID (equal to 0) are checked in probing parser
- It is important to enable detection port and define Modbus port
- to avoid false positive
modbus: # How many unreplied Modbus requests are considered a flood. # If the limit is reached, app-layer-event:modbus.flooded; will match.
#request-flood: 500 enabled: no
detection-ports:
dp: 502- According to MODBUS Messaging on TCP/IP Implementation Guide V1.0b, it
- is recommended to keep the TCP connection opened with a remote device
- and not to open and close it for each MODBUS/TCP transaction. In that
- case, it is important to set the depth of the stream reassembling as
- unlimited (stream.reassembly.depth: 0)
- Stream reassembly size for modbus. By default track it completely.
stream-depth: 0
- DNP3
dnp3:
enabled: no
detection-ports:
dp: 20000
- SCADA EtherNet/IP and CIP protocol support
enip:
enabled: no
detection-ports:
dp: 44818
sp: 44818
- Note: parser depends on experimental Rust support
- with --enable-rust-experimental passed to configure
ntp:
enabled: no
- Completely stop processing TLS/SSL session after the handshake
# completed. If bypass is enabled this will also trigger flow
# bypass. If disabled (the default), TLS/SSL session is still
# tracked for Heartbleed and other anomalies.
- Limit for the maximum number of asn1 frames to decode (default 256)
asn1-max-frames: 256
- Advanced settings below ## ##############################################################################
- Run Options ##
- Run suricata as user and group.
#run-as: - user: suri
- group: suri
- Some logging module will use that name in event as identifier. The default
- value is the hostname
#sensor-name: suricata
- Default location of the pid file. The pid file is only used in
- daemon mode (start Suricata with -D). If not running in daemon mode
- the --pidfile command line option must be used to create a pid file.
#pid-file: /usr/local/suricata4/var/run/suricata.pid
- Daemon working directory
- Suricata will change directory to this one if provided
- Default: "/"
#daemon-directory: "/"
- Suricata core dump configuration. Limits the size of the core dump file to
- approximately max-dump. The actual core dump size will be a multiple of the
- page size. Core dumps that would be larger than max-dump are truncated. On
- Linux, the actual core dump size may be a few pages larger than max-dump.
- Setting max-dump to 0 disables core dumping.
- Setting max-dump to 'unlimited' will give the full core dump file.
- On 32-bit Linux, a max-dump value >= ULONG_MAX may cause the core dump size
- to be 'unlimited'.
coredump:
max-dump: unlimited
- If suricata box is a router for the sniffed networks, set it to 'router'. If
- it is a pure sniffing setup, set it to 'sniffer-only'.
- If set to auto, the variable is internally switch to 'router' in IPS mode
- and 'sniffer-only' in IDS mode.
- This feature is currently only used by the reject* keywords.
host-mode: auto
- Number of packets preallocated per thread. The default is 1024. A higher number
- will make sure each CPU will be more easily kept busy, but may negatively
- impact caching. #
- If you are using the CUDA pattern matcher (mpm-algo: ac-cuda), different rules
- apply. In that case try something like 60000 or more. This is because the CUDA
- pattern matcher buffers and scans as many packets as possible in parallel.
max-pending-packets: 60000
- Runmode the engine should use. Please check --list-runmodes to get the available
- runmodes for each packet acquisition method. Defaults to "autofp" (auto flow pinned
- load balancing).
runmode: workers
- Specifies the kind of flow load balancer used by the flow pinned autofp mode. #
- Supported schedulers are: #
- round-robin - Flows assigned to threads in a round robin fashion.
- active-packets - Flows assigned to threads that have the lowest number of
- unprocessed packets (default).
- hash - Flow alloted usihng the address hash. More of a random
- technique. Was the default in Suricata 1.2.1 and older.
#
#autofp-scheduler: active-packets
- Preallocated size for packet. Default is 1514 which is the classical
- size for pcap on ethernet. You should adjust this value to the highest
- packet size (MTU + hardware header) on your system.
default-packet-size: 1522
- Unix command socket can be used to pass commands to suricata.
- An external tool can then connect to get information from suricata
- or trigger some modifications of the engine. Set enabled to yes
- to activate the feature. In auto mode, the feature will only be
- activated in live capture mode. You can use the filename variable to set
- the file name of the socket.
unix-command:
enabled: auto
#filename: custom.socket
- Magic file. The extension .mgc is added to the value here.
#magic-file: /usr/share/file/magic
#magic-file:
legacy:
uricontent: enabled
- Detection settings ##
- Set the order of alerts bassed on actions
- The default order is pass, drop, reject, alert
- action-order:
- - pass
- - drop
- - reject
- - alert
- IP Reputation
#reputation-categories-file: /usr/local/suricata4/etc/suricata/iprep/categories.txt
#default-reputation-path: /usr/local/suricata4/etc/suricata/iprep
#reputation-files: - - reputation.list
- When run with the option --engine-analysis, the engine will read each of
- the parameters below, and print reports for each of the enabled sections
- and exit. The reports are printed to a file in the default log dir
- given by the parameter "default-log-dir", with engine reporting
- subsection below printing reports in its own report file.
engine-analysis: # enables printing reports for fast-pattern for every rule.
rules-fast-pattern: yes # enables printing reports for each rule
rules: yes
#recursion and match limits for PCRE where supported
pcre:
match-limit: 3500
match-limit-recursion: 1500
- Advanced Traffic Tracking and Reconstruction Settings ##
- Host specific policies for defragmentation and TCP stream
- reassembly. The host OS lookup is done using a radix tree, just
- like a routing table so the most specific entry matches.
host-os-policy: # Make the default policy windows.
windows: [0.0.0.0/0]
bsd: []
bsd-right: []
old-linux: []
linux: []
old-solaris: []
solaris: []
hpux10: []
hpux11: []
irix: []
macos: []
vista: []
windows2k3: []
- Defrag settings:
defrag:
memcap: 512mb
hash-size: 65536
trackers: 65535 # number of defragmented flows to follow
max-frags: 65535 # number of fragments to keep (higher than trackers)
prealloc: yes
timeout: 60
- Enable defrag per host settings
- host-config: #
- - dmz:
- timeout: 30
- address: [192.168.1.0/24, 127.0.0.0/8, 1.1.1.0/24, 2.2.2.0/24, "1.1.1.1", "2.2.2.2", "::1"] #
- - lan:
- timeout: 45
- address:
- - 192.168.0.0/24
- - 192.168.10.0/24
- - 172.16.14.0/24
- Flow settings:
- By default, the reserved memory (memcap) for flows is 32MB. This is the limit
- for flow allocation inside the engine. You can change this value to allow
- more memory usage for flows.
- The hash-size determine the size of the hash used to identify flows inside
- the engine, and by default the value is 65536.
- At the startup, the engine can preallocate a number of flows, to get a better
- performance. The number of flows preallocated is 10000 by default.
- emergency-recovery is the percentage of flows that the engine need to
- prune before unsetting the emergency state. The emergency state is activated
- when the memcap limit is reached, allowing to create new flows, but
- prunning them with the emergency timeouts (they are defined below).
- If the memcap is reached, the engine will try to prune flows
- with the default timeouts. If it doens't find a flow to prune, it will set
- the emergency bit and it will try again with more agressive timeouts.
- If that doesn't work, then it will try to kill the last time seen flows
- not in use.
- The memcap can be specified in kb, mb, gb. Just a number indicates it's
- in bytes.
flow:
memcap: 1gb
hash-size: 1048576
prealloc: 1048576
emergency-recovery: 30
#managers: 1 # default to one flow manager
#recyclers: 1 # default to one flow recycler thread
- This option controls the use of vlan ids in the flow (and defrag)
- hashing. Normally this should be enabled, but in some (broken)
- setups where both sides of a flow are not tagged with the same vlan
- tag, we can ignore the vlan id's in the flow hashing.
vlan:
use-for-tracking: true
- Specific timeouts for flows. Here you can specify the timeouts that the
- active flows will wait to transit from the current state to another, on each
- protocol. The value of "new" determine the seconds to wait after a hanshake or
- stream startup before the engine free the data of that flow it doesn't
- change the state to established (usually if we don't receive more packets
- of that flow). The value of "established" is the amount of
- seconds that the engine will wait to free the flow if it spend that amount
- without receiving new packets or closing the connection. "closed" is the
- amount of time to wait after a flow is closed (usually zero). "bypassed"
- timeout controls locally bypassed flows. For these flows we don't do any other
- tracking. If no packets have been seen after this timeout, the flow is discarded. #
- There's an emergency mode that will become active under attack circumstances,
- making the engine to check flow status faster. This configuration variables
- use the prefix "emergency-" and work similar as the normal ones.
- Some timeouts doesn't apply to all the protocols, like "closed", for udp and
- icmp.
flow-timeouts:
default:
    new: 30
    established: 300
    closed: 0
    bypassed: 100
    emergency-new: 10
    emergency-established: 100
    emergency-closed: 0
    emergency-bypassed: 50
  tcp:
    new: 60
    established: 600
    closed: 60
    bypassed: 100
    emergency-new: 5
    emergency-established: 100
    emergency-closed: 10
    emergency-bypassed: 50
  udp:
    new: 30
    established: 300
    bypassed: 100
    emergency-new: 10
    emergency-established: 100
    emergency-bypassed: 50
  icmp:
    new: 30
    established: 300
    bypassed: 100
    emergency-new: 10
    emergency-established: 100
emergency-bypassed: 50- Stream engine settings. Here the TCP stream tracking and reassembly
- engine is configured.
#
stream:
memcap: 12gb # Can be specified in kb, mb, gb. Just a - # number indicates it's in bytes.
checksum-validation: no # To validate the checksum of received - # packet. If csum validation is specified as
- # "yes", then packet with invalid csum will not
- # be processed by the engine stream/app layer.
- # Warning: locally generated trafic can be
- # generated without checksum due to hardware offload
- # of checksum. You can control the handling of checksum
- # on a per-interface basis via the 'checksum-checks'
- # option
prealloc-sessions: 50k # 2k sessions prealloc'd per stream thread midstream: false # don't allow midstream session pickups
midstream: true # don't allow midstream session pickups
async-oneside: true # don't enable async stream handling - inline: no # stream inline mode
- drop-invalid: yes # in inline mode, drop packets that are invalid with regards to streaming engine
- max-synack-queued: 5 # Max different SYN/ACKs to queue
- bypass: no # Bypass packets when stream.depth is reached
#
reassembly:
memcap: 20gb # Can be specified in kb, mb, gb. Just a number - # indicates it's in bytes.
depth: 12mb # Can be specified in kb, mb, gb. Just a number - # indicates it's in bytes.
- toserver-chunk-size: 2560 # inspect raw stream in chunks of at least
- # this size. Can be specified in kb, mb,
- # gb. Just a number indicates it's in bytes.
- toclient-chunk-size: 2560 # inspect raw stream in chunks of at least
- # this size. Can be specified in kb, mb,
- # gb. Just a number indicates it's in bytes.
- randomize-chunk-size: yes # Take a random value for chunk size around the specified value.
- # This lower the risk of some evasion technics but could lead
- # detection change between runs. It is set to 'yes' by default.
- randomize-chunk-range: 10 # If randomize-chunk-size is active, the value of chunk-size is
- # a random value between (1 - randomize-chunk-range/100)*toserver-chunk-size
- # and (1 + randomize-chunk-range/100)*toserver-chunk-size and the same
- # calculation for toclient-chunk-size.
- # Default value of randomize-chunk-range is 10. #
- raw: yes # 'Raw' reassembly enabled or disabled.
- # raw is for content inspection by detection
- # engine. #
- segment-prealloc: 2048 # number of segments preallocated per thread #
- check-overlap-different-data: true|false
- # check if a segment contains different data
- # than what we've already seen for that
- # position in the stream.
- # This is enabled automatically if inline mode
- # is used or when stream-event:reassembly_overlap_different_data;
- # is used in a rule.
#
stream:
memcap: 64mb
checksum-validation: yes # reject wrong csums
inline: auto # auto will use inline mode in IPS mode, yes or no set it statically
reassembly:
memcap: 256mb
depth: 1mb # reassemble 1mb into a stream
toserver-chunk-size: 2560
toclient-chunk-size: 2560
randomize-chunk-size: yes
#randomize-chunk-range: 10
#raw: yes
#segment-prealloc: 2048
#check-overlap-different-data: true
- Host table: #
- Host table is used by tagging and per host thresholding subsystems.
#
host:
hash-size: 4096
prealloc: 1000
memcap: 32mb
- IP Pair table: #
- Used by xbits 'ippair' tracking.
#
#ippair: - hash-size: 4096
- prealloc: 1000
- memcap: 32mb
- Decoder settings
decoder:
# Teredo decoder is known to not be completely accurate
# it will sometimes detect non-teredo as teredo.
teredo:
enabled: true
- Performance tuning and profiling ##
- The detection engine builds internal groups of signatures. The engine
- allow us to specify the profile to use for them, to manage memory on an
- efficient way keeping a good performance. For the profile keyword you
- can use the words "low", "medium", "high" or "custom". If you use custom
- make sure to define the values at "- custom-values" as your convenience.
- Usually you would prefer medium/high/low. #
- "sgh mpm-context", indicates how the staging should allot mpm contexts for
- the signature groups. "single" indicates the use of a single context for
- all the signature group heads. "full" indicates a mpm-context for each
- group head. "auto" lets the engine decide the distribution of contexts
- based on the information the engine gathers on the patterns from each
- group head. #
- The option inspection-recursion-limit is used to limit the recursive calls
- in the content inspection code. For certain payload-sig combinations, we
- might end up taking too much time in the content inspection code.
- If the argument specified is 0, the engine uses an internally defined
- default limit. On not specifying a value, we use no limits on the recursion.
detect:
profile: custom
custom-values:
toclient-groups: 200
toserver-groups: 200
sgh-mpm-context: full
inspection-recursion-limit: 9000 # If set to yes, the loading of signatures will be made after the capture # is started. This will limit the downtime in IPS mode.
#delayed-detect: yesprefilter: # default prefiltering setting. "mpm" only creates MPM/fast_pattern # engines. "auto" also sets up prefilter engines for other keywords. # Use --list-keywords=all to see which keywords support prefiltering.
default: mpm- the grouping values above control how many groups are created per
- direction. Port whitelisting forces that port to get it's own group.
- Very common ports will benefit, as well as ports with many expensive
- rules.
grouping:
#tcp-whitelist: 53, 80, 139, 443, 445, 1433, 3306, 3389, 6666, 6667, 8080
#udp-whitelist: 53, 135, 5060
profiling: # Log the rules that made it past the prefilter stage, per packet # default is off. The threshold setting determines how many rules # must have made it past pre-filter for that rule to trigger the # logging.
#inspect-logging-threshold: 200
grouping:
dump-to-disk: false
include-rules: false # very verbose
include-mpm-stats: false
- Select the multi pattern algorithm you want to run for scan/search the
- in the engine. #
- The supported algorithms are:
- "ac" - Aho-Corasick, default implementation
- "ac-bs" - Aho-Corasick, reduced memory implementation
- "ac-cuda" - Aho-Corasick, CUDA implementation
- "ac-ks" - Aho-Corasick, "Ken Steele" variant
- "hs" - Hyperscan, available when built with Hyperscan support #
- The default mpm-algo value of "auto" will use "hs" if Hyperscan is
- available, "ac" otherwise. #
- The mpm you choose also decides the distribution of mpm contexts for
- signature groups, specified by the conf - "detect.sgh-mpm-context".
- Selecting "ac" as the mpm would require "detect.sgh-mpm-context"
- to be set to "single", because of ac's memory requirements, unless the
- ruleset is small enough to fit in one's memory, in which case one can
- use "full" with "ac". Rest of the mpms can be run in "full" mode. #
- There is also a CUDA pattern matcher (only available if Suricata was
- compiled with --enable-cuda: b2g_cuda. Make sure to update your
- max-pending-packets setting above as well if you use b2g_cuda.
mpm-algo: auto
- Select the matching algorithm you want to use for single-pattern searches. #
- Supported algorithms are "bm" (Boyer-Moore) and "hs" (Hyperscan, only
- available if Suricata has been built with Hyperscan support). #
- The default of "auto" will use "hs" if available, otherwise "bm".
spm-algo: auto
- Suricata is multi-threaded. Here the threading can be influenced.
threading:
set-cpu-affinity: no # Tune cpu affinity of threads. Each family of threads can be bound # on specific CPUs. # # These 2 apply to the all runmodes: # management-cpu-set is used for flow timeout handling, counters # worker-cpu-set is used for 'worker' threads # # Additionally, for autofp these apply: # receive-cpu-set is used for capture threads # verdict-cpu-set is used for IPS verdict threads #
cpu-affinity:
- management-cpu-set:
cpu: [ 0 ] # include only these cpus in affinity settings
- receive-cpu-set:
cpu: [ 0 ] # include only these cpus in affinity settings
- worker-cpu-set:
cpu: [ "all" ]
mode: "exclusive" # Use explicitely 3 threads and don't compute number by using # detect-thread-ratio variable: # threads: 3
prio:
low: [ 0 ]
medium: [ "1-2" ]
high: [ 3 ]
default: "medium"
#- verdict-cpu-set: # cpu: [ 0 ] # prio: # default: "high" # # By default Suricata creates one "detect" thread per available CPU/CPU core. # This setting allows controlling this behaviour. A ratio setting of 2 will # create 2 detect threads for each CPU/CPU core. So for a dual core CPU this # will result in 4 detect threads. If values below 1 are used, less threads # are created. So on a dual core CPU a setting of 0.5 results in 1 detect # thread being created. Regardless of the setting at a minimum 1 detect # thread will always be created. #
detect-thread-ratio: 1.0
- Luajit has a strange memory requirement, it's 'states' need to be in the
- first 2G of the process' memory. #
- 'luajit.states' is used to control how many states are preallocated.
- State use: per detect script: 1 per detect thread. Per output script: 1 per
- script.
luajit:
states: 128
- Profiling settings. Only effective if Suricata has been built with the
- the --enable-profiling configure flag.
#
profiling: # Run profiling for every xth packet. The default is 1, which means we # profile every packet. If set to 1000, one packet is profiled for every # 1000 received.
#sample-rate: 1000- rule profiling
rules:- Profiling can be disabled here, but it will still have a
- performance impact if compiled in.
enabled: yes
filename: rule_perf.log
append: yes
- Sort options: ticks, avgticks, checks, matches, maxticks
- If commented out all the sort options will be used.
#sort: avgticks
- Limit the number of sids for which stats are shown at exit (per sort).
limit: 10
- output to json
json: yes
- per keyword profiling
keywords:
enabled: yes
filename: keyword_perf.log
append: yes
- per rulegroup profiling
rulegroups:
enabled: yes
filename: rule_group_perf.log
append: yes
- packet profiling
packets:- Profiling can be disabled here, but it will still have a
- performance impact if compiled in.
enabled: yes
filename: packet_stats.log
append: yes
- per packet csv output
csv:- Output can be disabled here, but it will still have a
- performance impact if compiled in.
enabled: no
filename: packet_stats.csv
- profiling of locking. Only available when Suricata was built with
- --enable-profiling-locks.
locks:
enabled: no
filename: lock_stats.log
append: yes
pcap-log:
enabled: no
filename: pcaplog_stats.log
append: yes - rule profiling
- Netfilter integration ##
- When running in NFQ inline mode, it is possible to use a simulated
- non-terminal NFQUEUE verdict.
- This permit to do send all needed packet to suricata via this a rule:
- iptables -I FORWARD -m mark ! --mark $MARK/$MASK -j NFQUEUE
- And below, you can have your standard filtering ruleset. To activate
- this mode, you need to set mode to 'repeat'
- If you want packet to be sent to another queue after an ACCEPT decision
- set mode to 'route' and set next-queue value.
- On linux >= 3.1, you can set batchcount to a value > 1 to improve performance
- by processing several packets before sending a verdict (worker runmode only).
- On linux >= 3.6, you can set the fail-open option to yes to have the kernel
- accept the packet if suricata is not able to keep pace.
- bypass mark and mask can be used to implement NFQ bypass. If bypass mark is
- set then the NFQ bypass is activated. Suricata will set the bypass mark/mask
- on packet of a flow that need to be bypassed. The Nefilter ruleset has to
- directly accept all packets of a flow once a packet has been marked.
nfq: - mode: accept
- repeat-mark: 1
- repeat-mask: 1
- bypass-mark: 1
- bypass-mask: 1
- route-queue: 2
- batchcount: 20
- fail-open: yes
#nflog support
nflog:
# netlink multicast group
# (the same as the iptables --nflog-group param)
# Group 0 is used by the kernel, so you can't use it
- group: 2
# netlink buffer size
buffer-size: 18432
# put default value here
- group: default
# set number of packet to queue inside kernel
qthreshold: 1
# set the delay before flushing packet in the queue inside kernel
qtimeout: 100
# netlink max buffer size
max-size: 20000
- Advanced Capture Options ##
- general settings affecting packet capture
capture: # disable NIC offloading. It's restored when Suricata exists. # Enabled by default
#disable-offloading: false # # disable checksum validation. Same as setting '-k none' on the # commandline
#checksum-validation: none
- Netmap support #
- Netmap operates with NIC directly in driver, so you need FreeBSD wich have
- built-in netmap support or compile and install netmap module and appropriate
- NIC driver on your Linux system.
- To reach maximum throughput disable all receive-, segmentation-,
- checksum- offloadings on NIC.
- Disabling Tx checksum offloading is required for connecting OS endpoint
- with NIC endpoint.
- You can find more information at https://github.com/luigirizzo/netmap
#
netmap: # To specify OS endpoint add plus sign at the end (e.g. "eth0+")
- interface: eth0 # Number of receive threads. "auto" uses number of RSS queues on interface.
#threads: auto # You can use the following variables to activate netmap tap or IPS mode. # If copy-mode is set to ips or tap, the traffic coming to the current # interface will be copied to the copy-iface interface. If 'tap' is set, the # copy is complete. If 'ips' is set, the packet matching a 'drop' action # will not be copied. # To specify the OS as the copy-iface (so the OS can route packets, or forward # to a service running on the same machine) add a plus sign at the end # (e.g. "copy-iface: eth0+"). Don't forget to set up a symmetrical eth0+ -> eth0 # for return packets. Hardware checksumming must be off on the interface if # using an OS endpoint (e.g. 'ifconfig eth0 -rxcsum -txcsum -rxcsum6 -txcsum6' for FreeBSD # or 'ethtool -K eth0 tx off rx off' for Linux).
#copy-mode: tap
#copy-iface: eth3 # Set to yes to disable promiscuous mode # disable-promisc: no # Choose checksum verification mode for the interface. At the moment # of the capture, some packets may be with an invalid checksum due to # offloading to the network card of the checksum computation. # Possible values are: # - yes: checksum validation is forced # - no: checksum validation is disabled # - auto: suricata uses a statistical approach to detect when # checksum off-loading is used. # Warning: 'checksum-validation' must be set to yes to have any validation
#checksum-checks: auto # BPF filter to apply to this interface. The pcap filter syntax apply here.
#bpf-filter: port 80 or udp
#- interface: eth3
#threads: auto
#copy-mode: tap
#copy-iface: eth2 # Put default values here
- interface: default
- PF_RING configuration. for use with native PF_RING support
- for more info see http://www.ntop.org/products/pf_ring/
pfring:
- interface: p4p2 # Number of receive threads (>1 will enable experimental flow pinned # runmode)
threads: 16- Default clusterid. PF_RING will load balance packets based on flow.
# All threads/processes that will participate need to have the same
# clusterid.
cluster-id: 99 - Second interface
#- interface: p4p2 - threads: 3
- cluster-id: 93
- cluster-type: cluster_flow
- Put default values here
- interface: p4p2
#threads: 2
- Default PF_RING cluster type. PF_RING can load balance per flow.
- Possible values are cluster_flow or cluster_round_robin.
cluster-type: cluster_flow - bpf filter for this interface
#bpf-filter: tcp - Choose checksum verification mode for the interface. At the moment
- of the capture, some packets may be with an invalid checksum due to
- offloading to the network card of the checksum computation.
- Possible values are:
- - rxonly: only compute checksum for packets received by network card.
- - yes: checksum validation is forced
- - no: checksum validation is disabled
- - auto: suricata uses a statistical approach to detect when
- checksum off-loading is used. (default)
- Warning: 'checksum-validation' must be set to yes to have any validation
#checksum-checks: auto
- Default clusterid. PF_RING will load balance packets based on flow.
# All threads/processes that will participate need to have the same
# clusterid.
- For FreeBSD ipfw(8) divert(4) support.
- Please make sure you have ipfw_load="YES" and ipdivert_load="YES"
- in /etc/loader.conf or kldload'ing the appropriate kernel modules.
- Additionally, you need to have an ipfw rule for the engine to see
- the packets from ipfw. For Example: #
- ipfw add 100 divert 8000 ip from any to any #
- The 8000 above should be the same number you passed on the command
- line, i.e. -d 8000
#
ipfw:- Reinject packets at the specified ipfw rule number. This config
- option is the ipfw rule number AT WHICH rule processing continues
- in the ipfw processing system after the engine has finished
- inspecting the packet for acceptance. If no rule number is specified,
- accepted packets are reinjected at the divert rule which they entered
- and IPFW rule processing continues. No check is done to verify
- this will rule makes sense so care must be taken to avoid loops in ipfw.
#
- The following example tells the engine to reinject packets
- back into the ipfw firewall AT rule number 5500: #
- ipfw-reinjection-rule-number: 5500
napatech:
# The Host Buffer Allowance for all streams
# (-1 = OFF, 1 - 100 = percentage of the host buffer that can be held back)
# This may be enabled when sharing streams with another application.
# Otherwise, it should be turned off.
hba: -1
- use_all_streams set to "yes" will query the Napatech service for all configured
- streams and listen on all of them. When set to "no" the streams config array
- will be used.
use-all-streams: yes
- The streams to listen on. This can be either:
- a list of individual streams (e.g. streams: [0,1,2,3])
- or
- a range of streams (e.g. streams: ["0-3"])
streams: ["0-3"]
- Tilera mpipe configuration. for use on Tilera TILE-Gx.
mpipe:- Load balancing modes: "static", "dynamic", "sticky", or "round-robin".
load-balance: dynamic
- Number of Packets in each ingress packet queue. Must be 128, 512, 2028 or 65536
iqueue-packets: 2048
- List of interfaces we will listen on.
inputs:
- interface: xgbe2
- interface: xgbe3
- interface: xgbe4
- Relative weight of memory for packets of each mPipe buffer size.
stack:
size128: 0
size256: 9
size512: 0
size1024: 0
size1664: 7
size4096: 0
size10386: 0
size16384: 0
- Load balancing modes: "static", "dynamic", "sticky", or "round-robin".
- Hardware accelaration ##
- Cuda configuration.
cuda: # The "mpm" profile. On not specifying any of these parameters, the engine's # internal default values are used, which are same as the ones specified in # in the default conf file.
mpm: # The minimum length required to buffer data to the gpu. # Anything below this is MPM'ed on the CPU. # Can be specified in kb, mb, gb. Just a number indicates it's in bytes. # A value of 0 indicates there's no limit.
data-buffer-size-min-limit: 0 # The maximum length for data that we would buffer to the gpu. # Anything over this is MPM'ed on the CPU. # Can be specified in kb, mb, gb. Just a number indicates it's in bytes.
data-buffer-size-max-limit: 1500 # The ring buffer size used by the CudaBuffer API to buffer data.
cudabuffer-buffer-size: 500mb # The max chunk size that can be sent to the gpu in a single go.
gpu-transfer-size: 50mb # The timeout limit for batching of packets in microseconds.
batching-timeout: 2000 # The device to use for the mpm. Currently we don't support load balancing # on multiple gpus. In case you have multiple devices on your system, you # can specify the device to use, using this conf. By default we hold 0, to # specify the first device cuda sees. To find out device-id associated with # the card(s) on the system run "suricata --list-cuda-cards".
device-id: 0 # No of Cuda streams used for asynchronous processing. All values > 0 are valid. # For this option you need a device with Compute Capability > 1.0.
cuda-streams: 2
- Include other configs ##
- Includes. Files included here will be handled as if they were
- inlined in this configuration file.
#include: include1.yaml
#include: include2.yaml
--------------
start:
/usr/local/suricata4.0.7/bin/suricata --pfring-int=p4p2 --pfring-cluster-id=99 --pfring-cluster-type=cluster_flow -c /usr/local/suricata4.0.7/etc/suricata/suricata.yaml
and i also tried afpacket mode
/usr/local/suricata4.0.7/bin/suricata --runmode workers --af-packet=p4p2 -c /usr/local/suricata4.0.7/etc/suricata/suricata.yaml
YL Updated by yg lu almost 7 years ago
sublime editor add some numbers in front of some line , i fix it below
%YAML 1.1
---
- Suricata configuration file. In addition to the comments describing all
- options in this file, full documentation can be found at:
- https://redmine.openinfosecfoundation.org/projects/suricata/wiki/Suricatayaml
- Step 1: inform Suricata about your network ##
vars:
# more specifc is better for alert accuracy and performance
address-groups:
#HOME_NET: "[192.168.0.0/16,10.0.0.0/8,172.16.0.0/12]"
#HOME_NET: "[192.168.0.0/16]"
#HOME_NET: "[10.0.0.0/8]"
#HOME_NET: "[172.16.0.0/12]"
HOME_NET: "any"
#EXTERNAL_NET: "!$HOME_NET"
    EXTERNAL_NET: "any"
HTTP_SERVERS: "$HOME_NET"
SMTP_SERVERS: "$HOME_NET"
SQL_SERVERS: "$HOME_NET"
DNS_SERVERS: "$HOME_NET"
TELNET_SERVERS: "$HOME_NET"
AIM_SERVERS: "$EXTERNAL_NET"
DNP3_SERVER: "$HOME_NET"
DNP3_CLIENT: "$HOME_NET"
MODBUS_CLIENT: "$HOME_NET"
MODBUS_SERVER: "$HOME_NET"
ENIP_CLIENT: "$HOME_NET"
ENIP_SERVER: "$HOME_NET"port-groups:
HTTP_PORTS: "80"
SHELLCODE_PORTS: "!80"
ORACLE_PORTS: 1521
SSH_PORTS: 22
DNP3_PORTS: 20000
MODBUS_PORTS: 502
FILE_DATA_PORTS: "[$HTTP_PORTS,110,143]"
FTP_PORTS: 21- Step 2: select the rules to enable or disable ##
rule-files: # - botcc.portgrouped.rules
- testcap.rules
- - emerging-activex.rules
- - decoder-events.rules # available in suricata sources under rules dir
- - stream-events.rules # available in suricata sources under rules dir
- - modbus-events.rules # available in suricata sources under rules dir
- - app-layer-events.rules # available in suricata sources under rules dir
- - dnp3-events.rules # available in suricata sources under rules dir
- - ntp-events.rules # available in suricata sources under rules dir
reference-config-file: /usr/local/suricata4/etc/suricata/reference.config
- threshold-file: /usr/local/suricata4/etc/suricata/threshold.config
- Step 3: select outputs to enable ##
- The default logging directory. Any log or output file will be
- placed here if its not specified with a full path name. This can be
- overridden with the -l command line parameter.
default-log-dir: /data/public/suricata4.0.5/log
- global stats configuration
stats:
enabled: yes # The interval field (in seconds) controls at what interval # the loggers are invoked.
interval: 8
- Configure the type of alert (and other) logging you would like.
outputs: # a line based alerts log similar to Snort's fast.log
- fast:
enabled: no
filename: fast.log
append: yes
#filetype: regular # 'regular', 'unix_stream' or 'unix_dgram'- Extensible Event Format (nicknamed EVE) event log in JSON format
- eve-log:
enabled: yes # filetype: redis #regular|syslog|unix_dgram|unix_stream|redis
filetype: regular #regular|syslog|unix_dgram|unix_stream|redis
filename: eve-httpall.json
#prefix: "@cee: " # prefix to prepend to each log entry # the following are valid when type: syslog above
#identity: "suricata"
#facility: local5
#level: Info ## possible levels: Emergency, Alert, Critical, ## Error, Warning, Notice, Info, Debug
redis:
server: 127.0.0.1
port: 6379 # async: true ## if redis replies are read asynchronously
mode: list ## possible values: list|lpush (default), rpush, channel|publish # ## lpush and rpush are using a Redis list. "list" is an alias for lpush # ## publish is using a Redis channel. "channel" is an alias for publish
key: suricata ## key or channel to use (default to suricata) # Redis pipelining set up. This will enable to only do a query every # 'batch-size' events. This should lower the latency induced by network # connection at the cost of some memory. There is no flushing implemented # so this setting as to be reserved to high traffic suricata.
pipelining:
enabled: yes ## set enable to yes to enable query pipelining
batch-size: 100 ## number of entry to keep in buffer
types:
- alert: # payload: yes # enable dumping payload in Base64 # payload-buffer-size: 10240kb # max size of payload buffer to output in eve-log # payload-printable: yes # enable dumping payload in printable (lossy) format # packet: yes # enable dumping of packet (without stream segments)
http-body: yes # enable dumping of http body in Base64 # http-body-printable: yes # enable dumping of http body in printable format
metadata: yes # add L7/applayer fields, flowbit and other vars to the alert- Enable the logging of tagged packets for rules using the
# "tag" keyword.
tagged-packets: yes - alerts: yes # log alerts that caused drops
- flows: all # start or all: 'start' logs only a single drop
- # per flow direction. All logs each dropped pkt.
- - smtp:
#extended: yes # enable this for extended logging information # this includes: bcc, message-id, subject, x_mailer, user-agent # custom fields logging from the list: # reply-to, bcc, message-id, subject, x-mailer, user-agent, received, # x-originating-ip, in-reply-to, references, importance, priority, # sensitivity, organization, content-md5, date
#custom: [received, x-mailer, x-originating-ip, relays, reply-to, bcc] # output md5 of fields: body, subject # for the body you need to set app-layer.protocols.smtp.mime.body-md5 # to yes
#md5: [body, subject]
- HTTP X-Forwarded-For support by adding an extra field or overwriting
- the source or destination IP address (depending on flow direction)
- with the one reported in the X-Forwarded-For HTTP header. This is
- helpful when reviewing alerts for traffic that is being reverse
- or forward proxied.
xff:
enabled: yes # Two operation modes are available, "extra-data" and "overwrite".
mode: extra-data # Two proxy deployments are supported, "reverse" and "forward". In # a "reverse" deployment the IP address used is the last one, in a # "forward" deployment the first IP address is used.
deployment: forward # Header name where the actual IP address will be reported, if more # than one IP address is present, the last IP address will be the # one taken into consideration.
header: X-Forwarded-For
#- http:
#extended: no # enable this for extended logging information - custom allows additional http fields to be included in eve-log
- the example below adds three additional fields when uncommented
#custom: [Accept-Encoding, Accept-Language, Authorization]
#- dns: - control logging of queries and answers
- default yes, no to disable
#query: no # enable logging of DNS queries
#answer: no # enable logging of DNS answers - control which RR types are logged
- all enabled if custom not specified
#custom: [a, aaaa, cname, mx, ns, ptr, txt]
#- tls:
#extended: no # enable this for extended logging information - output TLS transaction where the session is resumed using a
- session id
#session-resumption: no - custom allows to control which tls fields that are included
- in eve-log
#custom: [subject, issuer, session_resumed, serial, fingerprint, sni, version, not_before, not_after, certificate, chain]
#- files:
#force-magic: no # force logging magic on all logged files - force logging of checksums, available hash functions are md5,
- sha1 and sha256
#force-hash: [md5]
#- drop:
- Enable the logging of tagged packets for rules using the
# "tag" keyword.
- dnp3
#- nfs- - ssh
#- stats: - totals: no # stats for all threads merged together
- threads: no # per thread stats
- deltas: no # include delta values
- bi-directional flows
- - flow
- uni-directional flows
#- netflow - Vars log flowbits and other packet and flow vars
#- vars
- - ssh
- alert output for use with Barnyard2
- unified2-alert:
enabled: no
filename: unified2.alert- File size limit. Can be specified in kb, mb, gb. Just a number
- is parsed as bytes.
#limit: 32mb
- By default unified2 log files have the file creation time (in
- unix epoch format) appended to the filename. Set this to yes to
- disable this behaviour.
#nostamp: no
- Sensor ID field of unified2 alerts.
#sensor-id: 0
- Include payload of packets related to alerts. Defaults to true, set to
- false if payload is not required.
#payload: yes
- HTTP X-Forwarded-For support by adding the unified2 extra header or
- overwriting the source or destination IP address (depending on flow
- direction) with the one reported in the X-Forwarded-For HTTP header.
- This is helpful when reviewing alerts for traffic that is being reverse
- or forward proxied.
xff:
enabled: no # Two operation modes are available, "extra-data" and "overwrite". Note # that in the "overwrite" mode, if the reported IP address in the HTTP # X-Forwarded-For header is of a different version of the packet # received, it will fall-back to "extra-data" mode.
mode: extra-data # Two proxy deployments are supported, "reverse" and "forward". In # a "reverse" deployment the IP address used is the last one, in a # "forward" deployment the first IP address is used.
deployment: reverse # Header name where the actual IP address will be reported, if more # than one IP address is present, the last IP address will be the # one taken into consideration.
header: X-Forwarded-For
- a line based log of HTTP requests (no alerts)
- http-log:
enabled: no
filename: http.log
append: yes
#extended: yes # enable this for extended logging information
#custom: yes # enabled the custom logging format (defined by customformat)
#customformat: "%{%D-%H:%M:%S}t.%z %{X-Forwarded-For}i %H %m %h %u %s %B %a:%p -> %A:%P"
#filetype: regular # 'regular', 'unix_stream' or 'unix_dgram'
- a line based log of TLS handshake parameters (no alerts)
- tls-log:
enabled: no # Log TLS connections.
filename: tls.log # File to store TLS logs.
append: yes
#extended: yes # Log extended information like fingerprint
#custom: yes # enabled the custom logging format (defined by customformat)
#customformat: "%{%D-%H:%M:%S}t.%z %a:%p -> %A:%P %v %n %d %D"
#filetype: regular # 'regular', 'unix_stream' or 'unix_dgram' # output TLS transaction where the session is resumed using a # session id
#session-resumption: no
- output module to store certificates chain to disk
- tls-store:
enabled: no
#certs-log-dir: certs # directory to store the certificates files
- a line based log of DNS requests and/or replies (no alerts)
- dns-log:
enabled: no
filename: dns.log
append: yes
#filetype: regular # 'regular', 'unix_stream' or 'unix_dgram'
- Packet log... log packets in pcap format. 3 modes of operation: "normal"
- "multi" and "sguil". #
- In normal mode a pcap file "filename" is created in the default-log-dir,
- or are as specified by "dir".
- In multi mode, a file is created per thread. This will perform much
- better, but will create multiple files where 'normal' would create one.
- In multi mode the filename takes a few special variables:
- - %n -- thread number
- - %i -- thread id
- - %t -- timestamp (secs or secs.usecs based on 'ts-format'
- E.g. filename: pcap.%n.%t #
- Note that it's possible to use directories, but the directories are not
- created by Suricata. E.g. filename: pcaps/%n/log.%s will log into the
- per thread directory. #
- Also note that the limit and max-files settings are enforced per thread.
- So the size limit when using 8 threads with 1000mb files and 2000 files
- is: 8*1000*2000 ~ 16TiB. #
- In Sguil mode "dir" indicates the base directory. In this base dir the
- pcaps are created in th directory structure Sguil expects: #
- $sguil-base-dir/YYYY-MM-DD/$filename.<timestamp> #
- By default all packets are logged except:
- - TCP streams beyond stream.reassembly.depth
- - encrypted streams after the key exchange
#
- pcap-log:
enabled: yes
filename: log.pcap- File size limit. Can be specified in kb, mb, gb. Just a number
- is parsed as bytes.
limit: 1000mb
- If set to a value will enable ring buffer mode. Will keep Maximum of "max-files" of size "limit"
max-files: 2000
mode: normal # normal, multi or sguil.
- Directory to place pcap files. If not provided the default log
- directory will be used. Required for "sguil" mode.
#dir: /nsm_data/
#ts-format: usec # sec or usec second format (default) is filename.sec usec is filename.sec.usec
use-stream-depth: no #If set to "yes" packets seen after reaching stream inspection depth are ignored. "no" logs all packets
honor-pass-rules: no # If set to "yes", flows in which a pass rule matched will stopped being logged.
- a full alerts log containing much information for signature writers
- or for investigating suspected false positives.
- alert-debug:
enabled: no
filename: alert-debug.log
append: yes
#filetype: regular # 'regular', 'unix_stream' or 'unix_dgram'
- alert output to prelude (http://www.prelude-technologies.com/) only
- available if Suricata has been compiled with --enable-prelude
- alert-prelude:
enabled: no
profile: suricata
log-packet-content: no
log-packet-header: yes
- Stats.log contains data from various counters of the suricata engine.
- stats:
enabled: yes
filename: stats.log
append: yes # append to file (yes) or overwrite it (no)
totals: yes # stats for all threads merged together
threads: no # per thread stats
#null-values: yes # print counters that have value 0
- a line based alerts log similar to fast.log into syslog
- syslog:
enabled: no # reported identity to syslog. If ommited the program name (usually # suricata) will be used.
#identity: "suricata"
facility: local5
#level: Info ## possible levels: Emergency, Alert, Critical, ## Error, Warning, Notice, Info, Debug
- a line based information for dropped packets in IPS mode
- drop:
enabled: no
filename: drop.log
append: yes
#filetype: regular # 'regular', 'unix_stream' or 'unix_dgram'
- output module to store extracted files to disk #
- The files are stored to the log-dir in a format "file.<id>" where <id> is
- an incrementing number starting at 1. For each file "file.<id>" a meta
- file "file.<id>.meta" is created. #
- File extraction depends on a lot of things to be fully done:
- - file-store stream-depth. For optimal results, set this to 0 (unlimited)
- - http request / response body sizes. Again set to 0 for optimal results.
- - rules that contain the "filestore" keyword.
- file-store:
enabled: no # set to yes to enable
log-dir: files # directory to store the files
force-magic: no # force logging magic on all stored files # force logging of checksums, available hash functions are md5, # sha1 and sha256
#force-hash: [md5]
force-filestore: no # force storing of all files # override global stream-depth for sessions in which we want to # perform file extraction. Set to 0 for unlimited.
#stream-depth: 0
#waldo: file.waldo # waldo file to store the file_id across runs # uncomment to disable meta file writing
#write-meta: no # uncomment the following variable to define how many files can # remain open for filestore by Suricata. Default value is 0 which # means files get closed after each write
#max-open-files: 1000
- output module to log files tracked in a easily parsable json format
- file-log:
enabled: no
filename: files-json.log
append: yes
#filetype: regular # 'regular', 'unix_stream' or 'unix_dgram' force-magic: no # force logging magic on all logged files- force logging of checksums, available hash functions are md5,
- sha1 and sha256
#force-hash: [md5]
- Log TCP data after stream normalization
- 2 types: file or dir. File logs into a single logfile. Dir creates
- 2 files per TCP session and stores the raw TCP data into them.
- Using 'both' will enable both file and dir modes. #
- Note: limited by stream.depth
- tcp-data:
enabled: no
type: file
filename: tcp-data.log
- Log HTTP body data after normalization, dechunking and unzipping.
- 2 types: file or dir. File logs into a single logfile. Dir creates
- 2 files per HTTP session and stores the normalized data into them.
- Using 'both' will enable both file and dir modes. #
- Note: limited by the body limit settings
- http-body-data:
enabled: no
type: file
filename: http-data.log
- Lua Output Support - execute lua script to generate alert and event
- output.
- Documented at:
- https://redmine.openinfosecfoundation.org/projects/suricata/wiki/Lua_Output
- lua:
enabled: no
#scripts-dir: /etc/suricata/lua-output/
scripts: # - script1.lua
- Extensible Event Format (nicknamed EVE) event log in JSON format
- Logging configuration. This is not about logging IDS alerts/events, but
- output about what Suricata is doing, like startup messages, errors, etc.
logging: # The default log level, can be overridden in an output section. # Note that debug level logging will only be emitted if Suricata was # compiled with the --enable-debug configure option. # # This value is overriden by the SC_LOG_LEVEL env var.
default-log-level: notice- The default output format. Optional parameter, should default to
- something reasonable if not provided. Can be overriden in an
- output section. You can leave this out to get the default. #
- This value is overriden by the SC_LOG_FORMAT env var.
#default-log-format: "[%i] %t - (%f:%l) <%d> (%n) -- "
- A regex to filter output. Can be overridden in an output section.
- Defaults to empty (no filter). #
- This value is overriden by the SC_LOG_OP_FILTER env var.
default-output-filter:
- Define your logging outputs. If none are defined, or they are all
- disabled you will get the default - console output.
outputs:
- console:
enabled: yes # type: json
- file:
enabled: yes
level: info
filename: suricata.log # type: json
- syslog:
enabled: no
facility: local5
format: "[%i] <%d> -- " # type: json
- Step 4: configure common capture settings ##
- See "Advanced Capture Options" below for more options, including NETMAP
- and PF_RING. ##
- Linux high speed capture support
af-packet:
- interface: p4p2 # Number of receive threads. "auto" uses the number of cores
#threads: auto # Default clusterid. AF_PACKET will load balance packets based on flow.
cluster-id: 97 # Default AF_PACKET cluster type. AF_PACKET can load balance per flow or per hash. # This is only supported for Linux kernel > 3.1 # possible value are: # * cluster_round_robin: round robin load balancing # * cluster_flow: all packets of a given flow are send to the same socket # * cluster_cpu: all packets treated in kernel by a CPU are send to the same socket # * cluster_qm: all packets linked by network card to a RSS queue are sent to the same # socket. Requires at least Linux 3.14. # * cluster_random: packets are sent randomly to sockets but with an equipartition. # Requires at least Linux 3.14. # * cluster_rollover: kernel rotates between sockets filling each socket before moving # to the next. Requires at least Linux 3.10. # Recommended modes are cluster_flow on most boxes and cluster_cpu or cluster_qm on system # with capture card using RSS (require cpu affinity tuning and system irq tuning)
cluster-type: cluster_flow # In some fragmentation case, the hash can not be computed. If "defrag" is set # to yes, the kernel will do the needed defragmentation before sending the packets.
defrag: yes # After Linux kernel 3.10 it is possible to activate the rollover option: if a socket is # full then kernel will send the packet on the next socket with room available. This option # can minimize packet drop and increase the treated bandwidth on single intensive flow.
#rollover: yes # To use the ring feature of AF_PACKET, set 'use-mmap' to yes
use-mmap: no # Lock memory map to avoid it goes to swap. Be careful that over suscribing could lock # your system
#mmap-locked: yes # Use tpacket_v3 capture mode, only active if use-mmap is true # Don't use it in IPS or TAP mode as it causes severe latency
#tpacket-v3: yes # Ring size will be computed with respect to max_pending_packets and number # of threads. You can set manually the ring size in number of packets by setting # the following value. If you are using flow cluster-type and have really network # intensive single-flow you could want to set the ring-size independently of the number # of threads:
ring-size: 204800 # Block size is used by tpacket_v3 only. It should set to a value high enough to contain # a decent number of packets. Size is in bytes so please consider your MTU. It should be # a power of 2 and it must be multiple of page size (usually 4096).
#block-size: 32768 # tpacket_v3 block timeout: an open block is passed to userspace if it is not # filled after block-timeout milliseconds.
#block-timeout: 10 # On busy system, this could help to set it to yes to recover from a packet drop # phase. This will result in some packets (at max a ring flush) being non treated.
#use-emergency-flush: yes # recv buffer size, increase value could improve performance
buffer-size: 327680 # Set to yes to disable promiscuous mode # disable-promisc: no # Choose checksum verification mode for the interface. At the moment # of the capture, some packets may be with an invalid checksum due to # offloading to the network card of the checksum computation. # Possible values are: # - kernel: use indication sent by kernel for each packet (default) # - yes: checksum validation is forced # - no: checksum validation is disabled # - auto: suricata uses a statistical approach to detect when # checksum off-loading is used. # Warning: 'checksum-validation' must be set to yes to have any validation
#checksum-checks: kernel # BPF filter to apply to this interface. The pcap filter syntax apply here.
#bpf-filter: port 80 or udp # You can use the following variables to activate AF_PACKET tap or IPS mode. # If copy-mode is set to ips or tap, the traffic coming to the current # interface will be copied to the copy-iface interface. If 'tap' is set, the # copy is complete. If 'ips' is set, the packet matching a 'drop' action # will not be copied.
#copy-mode: ips
#copy-iface: eth1- Put default values here. These will be used for an interface that is not
- in the list above.
- interface: default
#threads: auto
#use-mmap: no
#rollover: yes
#tpacket-v3: yes
- Cross platform libpcap capture support
pcap:
- interface: eth0 # On Linux, pcap will try to use mmaped capture and will use buffer-size # as total of memory used by the ring. So set this to something bigger # than 1% of your bandwidth.
#buffer-size: 16777216
#bpf-filter: "tcp and port 25" # Choose checksum verification mode for the interface. At the moment # of the capture, some packets may be with an invalid checksum due to # offloading to the network card of the checksum computation. # Possible values are: # - yes: checksum validation is forced # - no: checksum validation is disabled # - auto: suricata uses a statistical approach to detect when # checksum off-loading is used. (default) # Warning: 'checksum-validation' must be set to yes to have any validation
#checksum-checks: auto # With some accelerator cards using a modified libpcap (like myricom), you # may want to have the same number of capture threads as the number of capture # rings. In this case, set up the threads variable to N to start N threads # listening on the same interface.
#threads: 16 # set to no to disable promiscuous mode:
#promisc: no # set snaplen, if not set it defaults to MTU if MTU can be known # via ioctl call and to full capture if not.
#snaplen: 1518 # Put default values here
- interface: default
#checksum-checks: auto
- Settings for reading pcap files
pcap-file: # Possible values are: # - yes: checksum validation is forced # - no: checksum validation is disabled # - auto: suricata uses a statistical approach to detect when # checksum off-loading is used. (default) # Warning: 'checksum-validation' must be set to yes to have checksum tested
checksum-checks: auto
- See "Advanced Capture Options" below for more options, including NETMAP
- and PF_RING.
- Step 5: App Layer Protocol Configuration ##
- Configure the app-layer parsers. The protocols section details each
- protocol. #
- The option "enabled" takes 3 values - "yes", "no", "detection-only".
- "yes" enables both detection and the parser, "no" disables both, and
- "detection-only" enables protocol detection only (parser disabled).
app-layer:
protocols:
tls:
enabled: no
detection-ports:
dp: 443- Completely stop processing TLS/SSL session after the handshake
# completed. If bypass is enabled this will also trigger flow
# bypass. If disabled (the default), TLS/SSL session is still
# tracked for Heartbleed and other anomalies.
#no-reassemble: yes
dcerpc:
enabled: no
ftp:
enabled: no
ssh:
enabled: no
smtp:
enabled: no # Configure SMTP-MIME Decoder
mime: # Decode MIME messages from SMTP transactions # (may be resource intensive) # This field supercedes all others because it turns the entire # process on or off
decode-mime: yes - smb2 detection is disabled internally inside the engine.
#smb2: - enabled: yes
- Note: NFS parser depends on Rust support: pass --enable-rust
- to configure.
nfs:
enabled: no
dns:
enabled: no # memcaps. Globally and per flow/state.
#global-memcap: 16mb
#state-memcap: 512kb
- How many unreplied DNS requests are considered a flood.
- If the limit is reached, app-layer-event:dns.flooded; will match.
#request-flood: 500
enabled: no
detection-ports:
dp: 53
udp:
enabled: no
detection-ports:
dp: 53
http:
enabled: yes- memcap: 64mb
- default-config: Used when no server-config matches
- personality: List of personalities used by default
- request-body-limit: Limit reassembly of request body for inspection
- by http_client_body & pcre /P option.
- response-body-limit: Limit reassembly of response body for inspection
- by file_data, http_server_body & pcre /Q option.
- double-decode-path: Double decode path section of the URI
- double-decode-query: Double decode query section of the URI
- response-body-decompress-layer-limit:
- Limit to how many layers of compression will be
- decompressed. Defaults to 2. #
- server-config: List of server configurations to use if address matches
- address: List of ip addresses or networks for this block
- personalitiy: List of personalities used by this block
- request-body-limit: Limit reassembly of request body for inspection
- by http_client_body & pcre /P option.
- response-body-limit: Limit reassembly of response body for inspection
- by file_data, http_server_body & pcre /Q option.
- double-decode-path: Double decode path section of the URI
- double-decode-query: Double decode query section of the URI #
- uri-include-all: Include all parts of the URI. By default the
- 'scheme', username/password, hostname and port
- are excluded. Setting this option to true adds
- all of them to the normalized uri as inspected
- by http_uri, urilen, pcre with /U and the other
- keywords that inspect the normalized uri.
- Note that this does not affect http_raw_uri.
- Also, note that including all was the default in
- 1.4 and 2.0beta1. #
- meta-field-limit: Hard size limit for request and response size
- limits. Applies to request line and headers,
- response line and headers. Does not apply to
- request or response bodies. Default is 18k.
- If this limit is reached an event is raised. #
- Currently Available Personalities:
- Minimal, Generic, IDS (default), IIS_4_0, IIS_5_0, IIS_5_1, IIS_6_0,
- IIS_7_0, IIS_7_5, Apache_2
libhtp:
default-config:
personality: IDS- Can be specified in kb, mb, gb. Just a number indicates
# it's in bytes.
request-body-limit: 100kb
response-body-limit: 100kb
- inspection limits
request-body-minimal-inspect-size: 32kb
request-body-inspect-window: 4kb
response-body-minimal-inspect-size: 40kb
response-body-inspect-window: 16kb
- response body decompression (0 disables)
response-body-decompress-layer-limit: 2
- auto will use http-body-inline mode in IPS mode, yes or no set it statically
http-body-inline: auto
- Take a random value for inspection sizes around the specified value.
- This lower the risk of some evasion technics but could lead
- detection change between runs. It is set to 'yes' by default.
#randomize-inspection-sizes: yes - If randomize-inspection-sizes is active, the value of various
- inspection size will be choosen in the [1 - range%, 1 + range%]
- range
- Default value of randomize-inspection-range is 10.
#randomize-inspection-range: 10
- decoding
double-decode-path: no
double-decode-query: no
server-config:
- Can be specified in kb, mb, gb. Just a number indicates
# it's in bytes.
- apache:
- address: [192.168.1.0/24, 127.0.0.0/8, "::1"]
- personality: Apache_2
- # Can be specified in kb, mb, gb. Just a number indicates
- # it's in bytes.
- request-body-limit: 4096
- response-body-limit: 4096
- double-decode-path: no
- double-decode-query: no
- iis7:
- address:
- - 192.168.0.0/24
- - 192.168.10.0/24
- personality: IIS_7_0
- # Can be specified in kb, mb, gb. Just a number indicates
- # it's in bytes.
- request-body-limit: 4096
- response-body-limit: 4096
- double-decode-path: no
- double-decode-query: no
- Note: Modbus probe parser is minimalist due to the poor significant field
- Only Modbus message length (greater than Modbus header length)
- And Protocol ID (equal to 0) are checked in probing parser
- It is important to enable detection port and define Modbus port
- to avoid false positive
modbus: # How many unreplied Modbus requests are considered a flood. # If the limit is reached, app-layer-event:modbus.flooded; will match.
#request-flood: 500 enabled: no
detection-ports:
dp: 502- According to MODBUS Messaging on TCP/IP Implementation Guide V1.0b, it
- is recommended to keep the TCP connection opened with a remote device
- and not to open and close it for each MODBUS/TCP transaction. In that
- case, it is important to set the depth of the stream reassembling as
- unlimited (stream.reassembly.depth: 0)
- Stream reassembly size for modbus. By default track it completely.
stream-depth: 0
- DNP3
dnp3:
enabled: no
detection-ports:
dp: 20000
- SCADA EtherNet/IP and CIP protocol support
enip:
enabled: no
detection-ports:
dp: 44818
sp: 44818
- Note: parser depends on experimental Rust support
- with --enable-rust-experimental passed to configure
ntp:
enabled: no
- Completely stop processing TLS/SSL session after the handshake
# completed. If bypass is enabled this will also trigger flow
# bypass. If disabled (the default), TLS/SSL session is still
# tracked for Heartbleed and other anomalies.
- Limit for the maximum number of asn1 frames to decode (default 256)
asn1-max-frames: 256
- Advanced settings below ## ##############################################################################
- Run Options ##
- Run suricata as user and group.
#run-as: - user: suri
- group: suri
- Some logging module will use that name in event as identifier. The default
- value is the hostname
#sensor-name: suricata
- Default location of the pid file. The pid file is only used in
- daemon mode (start Suricata with -D). If not running in daemon mode
- the --pidfile command line option must be used to create a pid file.
#pid-file: /usr/local/suricata4/var/run/suricata.pid
- Daemon working directory
- Suricata will change directory to this one if provided
- Default: "/"
#daemon-directory: "/"
- Suricata core dump configuration. Limits the size of the core dump file to
- approximately max-dump. The actual core dump size will be a multiple of the
- page size. Core dumps that would be larger than max-dump are truncated. On
- Linux, the actual core dump size may be a few pages larger than max-dump.
- Setting max-dump to 0 disables core dumping.
- Setting max-dump to 'unlimited' will give the full core dump file.
- On 32-bit Linux, a max-dump value >= ULONG_MAX may cause the core dump size
- to be 'unlimited'.
coredump:
max-dump: unlimited
- If suricata box is a router for the sniffed networks, set it to 'router'. If
- it is a pure sniffing setup, set it to 'sniffer-only'.
- If set to auto, the variable is internally switch to 'router' in IPS mode
- and 'sniffer-only' in IDS mode.
- This feature is currently only used by the reject* keywords.
host-mode: auto
- Number of packets preallocated per thread. The default is 1024. A higher number
- will make sure each CPU will be more easily kept busy, but may negatively
- impact caching. #
- If you are using the CUDA pattern matcher (mpm-algo: ac-cuda), different rules
- apply. In that case try something like 60000 or more. This is because the CUDA
- pattern matcher buffers and scans as many packets as possible in parallel.
max-pending-packets: 60000
- Runmode the engine should use. Please check --list-runmodes to get the available
- runmodes for each packet acquisition method. Defaults to "autofp" (auto flow pinned
- load balancing).
runmode: workers
- Specifies the kind of flow load balancer used by the flow pinned autofp mode. #
- Supported schedulers are: #
- round-robin - Flows assigned to threads in a round robin fashion.
- active-packets - Flows assigned to threads that have the lowest number of
- unprocessed packets (default).
- hash - Flow alloted usihng the address hash. More of a random
- technique. Was the default in Suricata 1.2.1 and older.
#
#autofp-scheduler: active-packets
- Preallocated size for packet. Default is 1514 which is the classical
- size for pcap on ethernet. You should adjust this value to the highest
- packet size (MTU + hardware header) on your system.
default-packet-size: 1522
- Unix command socket can be used to pass commands to suricata.
- An external tool can then connect to get information from suricata
- or trigger some modifications of the engine. Set enabled to yes
- to activate the feature. In auto mode, the feature will only be
- activated in live capture mode. You can use the filename variable to set
- the file name of the socket.
unix-command:
enabled: auto
#filename: custom.socket
- Magic file. The extension .mgc is added to the value here.
#magic-file: /usr/share/file/magic
#magic-file:
legacy:
uricontent: enabled
- Detection settings ##
- Set the order of alerts bassed on actions
- The default order is pass, drop, reject, alert
- action-order:
- - pass
- - drop
- - reject
- - alert
- IP Reputation
#reputation-categories-file: /usr/local/suricata4/etc/suricata/iprep/categories.txt
#default-reputation-path: /usr/local/suricata4/etc/suricata/iprep
#reputation-files: - - reputation.list
- When run with the option --engine-analysis, the engine will read each of
- the parameters below, and print reports for each of the enabled sections
- and exit. The reports are printed to a file in the default log dir
- given by the parameter "default-log-dir", with engine reporting
- subsection below printing reports in its own report file.
engine-analysis: # enables printing reports for fast-pattern for every rule.
rules-fast-pattern: yes # enables printing reports for each rule
rules: yes
#recursion and match limits for PCRE where supported
pcre:
match-limit: 3500
match-limit-recursion: 1500
- Advanced Traffic Tracking and Reconstruction Settings ##
- Host specific policies for defragmentation and TCP stream
- reassembly. The host OS lookup is done using a radix tree, just
- like a routing table so the most specific entry matches.
host-os-policy: # Make the default policy windows.
windows: [0.0.0.0/0]
bsd: []
bsd-right: []
old-linux: []
linux: []
old-solaris: []
solaris: []
hpux10: []
hpux11: []
irix: []
macos: []
vista: []
windows2k3: []
- Defrag settings:
defrag:
memcap: 512mb
hash-size: 65536
trackers: 65535 # number of defragmented flows to follow
max-frags: 65535 # number of fragments to keep (higher than trackers)
prealloc: yes
timeout: 60
- Enable defrag per host settings
- host-config: #
- - dmz:
- timeout: 30
- address: [192.168.1.0/24, 127.0.0.0/8, 1.1.1.0/24, 2.2.2.0/24, "1.1.1.1", "2.2.2.2", "::1"] #
- - lan:
- timeout: 45
- address:
- - 192.168.0.0/24
- - 192.168.10.0/24
- - 172.16.14.0/24
- Flow settings:
- By default, the reserved memory (memcap) for flows is 32MB. This is the limit
- for flow allocation inside the engine. You can change this value to allow
- more memory usage for flows.
- The hash-size determine the size of the hash used to identify flows inside
- the engine, and by default the value is 65536.
- At the startup, the engine can preallocate a number of flows, to get a better
- performance. The number of flows preallocated is 10000 by default.
- emergency-recovery is the percentage of flows that the engine need to
- prune before unsetting the emergency state. The emergency state is activated
- when the memcap limit is reached, allowing to create new flows, but
- prunning them with the emergency timeouts (they are defined below).
- If the memcap is reached, the engine will try to prune flows
- with the default timeouts. If it doens't find a flow to prune, it will set
- the emergency bit and it will try again with more agressive timeouts.
- If that doesn't work, then it will try to kill the last time seen flows
- not in use.
- The memcap can be specified in kb, mb, gb. Just a number indicates it's
- in bytes.
flow:
memcap: 1gb
hash-size: 1048576
prealloc: 1048576
emergency-recovery: 30
#managers: 1 # default to one flow manager
#recyclers: 1 # default to one flow recycler thread
- This option controls the use of vlan ids in the flow (and defrag)
- hashing. Normally this should be enabled, but in some (broken)
- setups where both sides of a flow are not tagged with the same vlan
- tag, we can ignore the vlan id's in the flow hashing.
vlan:
use-for-tracking: true
- Specific timeouts for flows. Here you can specify the timeouts that the
- active flows will wait to transit from the current state to another, on each
- protocol. The value of "new" determine the seconds to wait after a hanshake or
- stream startup before the engine free the data of that flow it doesn't
- change the state to established (usually if we don't receive more packets
- of that flow). The value of "established" is the amount of
- seconds that the engine will wait to free the flow if it spend that amount
- without receiving new packets or closing the connection. "closed" is the
- amount of time to wait after a flow is closed (usually zero). "bypassed"
- timeout controls locally bypassed flows. For these flows we don't do any other
- tracking. If no packets have been seen after this timeout, the flow is discarded. #
- There's an emergency mode that will become active under attack circumstances,
- making the engine to check flow status faster. This configuration variables
- use the prefix "emergency-" and work similar as the normal ones.
- Some timeouts doesn't apply to all the protocols, like "closed", for udp and
- icmp.
flow-timeouts:
default:
    new: 30
    established: 300
    closed: 0
    bypassed: 100
    emergency-new: 10
    emergency-established: 100
    emergency-closed: 0
    emergency-bypassed: 50
  tcp:
    new: 60
    established: 600
    closed: 60
    bypassed: 100
    emergency-new: 5
    emergency-established: 100
    emergency-closed: 10
    emergency-bypassed: 50
  udp:
    new: 30
    established: 300
    bypassed: 100
    emergency-new: 10
    emergency-established: 100
    emergency-bypassed: 50
  icmp:
    new: 30
    established: 300
    bypassed: 100
    emergency-new: 10
    emergency-established: 100
emergency-bypassed: 50- Stream engine settings. Here the TCP stream tracking and reassembly
- engine is configured.
#
stream:
memcap: 12gb # Can be specified in kb, mb, gb. Just a - # number indicates it's in bytes.
checksum-validation: no # To validate the checksum of received - # packet. If csum validation is specified as
- # "yes", then packet with invalid csum will not
- # be processed by the engine stream/app layer.
- # Warning: locally generated trafic can be
- # generated without checksum due to hardware offload
- # of checksum. You can control the handling of checksum
- # on a per-interface basis via the 'checksum-checks'
- # option
prealloc-sessions: 50k # 2k sessions prealloc'd per stream thread midstream: false # don't allow midstream session pickups
midstream: true # don't allow midstream session pickups
async-oneside: true # don't enable async stream handling - inline: no # stream inline mode
- drop-invalid: yes # in inline mode, drop packets that are invalid with regards to streaming engine
- max-synack-queued: 5 # Max different SYN/ACKs to queue
- bypass: no # Bypass packets when stream.depth is reached
#
reassembly:
memcap: 20gb # Can be specified in kb, mb, gb. Just a number - # indicates it's in bytes.
depth: 12mb # Can be specified in kb, mb, gb. Just a number - # indicates it's in bytes.
- toserver-chunk-size: 2560 # inspect raw stream in chunks of at least
- # this size. Can be specified in kb, mb,
- # gb. Just a number indicates it's in bytes.
- toclient-chunk-size: 2560 # inspect raw stream in chunks of at least
- # this size. Can be specified in kb, mb,
- # gb. Just a number indicates it's in bytes.
- randomize-chunk-size: yes # Take a random value for chunk size around the specified value.
- # This lower the risk of some evasion technics but could lead
- # detection change between runs. It is set to 'yes' by default.
- randomize-chunk-range: 10 # If randomize-chunk-size is active, the value of chunk-size is
- # a random value between (1 - randomize-chunk-range/100)*toserver-chunk-size
- # and (1 + randomize-chunk-range/100)*toserver-chunk-size and the same
- # calculation for toclient-chunk-size.
- # Default value of randomize-chunk-range is 10. #
- raw: yes # 'Raw' reassembly enabled or disabled.
- # raw is for content inspection by detection
- # engine. #
- segment-prealloc: 2048 # number of segments preallocated per thread #
- check-overlap-different-data: true|false
- # check if a segment contains different data
- # than what we've already seen for that
- # position in the stream.
- # This is enabled automatically if inline mode
- # is used or when stream-event:reassembly_overlap_different_data;
- # is used in a rule.
#
stream:
memcap: 64mb
checksum-validation: yes # reject wrong csums
inline: auto # auto will use inline mode in IPS mode, yes or no set it statically
reassembly:
memcap: 256mb
depth: 1mb # reassemble 1mb into a stream
toserver-chunk-size: 2560
toclient-chunk-size: 2560
randomize-chunk-size: yes
#randomize-chunk-range: 10
#raw: yes
#segment-prealloc: 2048
#check-overlap-different-data: true
- Host table: #
- Host table is used by tagging and per host thresholding subsystems.
#
host:
hash-size: 4096
prealloc: 1000
memcap: 32mb
- IP Pair table: #
- Used by xbits 'ippair' tracking.
#
#ippair: - hash-size: 4096
- prealloc: 1000
- memcap: 32mb
- Decoder settings
decoder:
# Teredo decoder is known to not be completely accurate
# it will sometimes detect non-teredo as teredo.
teredo:
enabled: true
- Performance tuning and profiling ##
- The detection engine builds internal groups of signatures. The engine
- allow us to specify the profile to use for them, to manage memory on an
- efficient way keeping a good performance. For the profile keyword you
- can use the words "low", "medium", "high" or "custom". If you use custom
- make sure to define the values at "- custom-values" as your convenience.
- Usually you would prefer medium/high/low. #
- "sgh mpm-context", indicates how the staging should allot mpm contexts for
- the signature groups. "single" indicates the use of a single context for
- all the signature group heads. "full" indicates a mpm-context for each
- group head. "auto" lets the engine decide the distribution of contexts
- based on the information the engine gathers on the patterns from each
- group head. #
- The option inspection-recursion-limit is used to limit the recursive calls
- in the content inspection code. For certain payload-sig combinations, we
- might end up taking too much time in the content inspection code.
- If the argument specified is 0, the engine uses an internally defined
- default limit. On not specifying a value, we use no limits on the recursion.
detect:
profile: custom
custom-values:
toclient-groups: 200
toserver-groups: 200
sgh-mpm-context: full
inspection-recursion-limit: 9000 # If set to yes, the loading of signatures will be made after the capture # is started. This will limit the downtime in IPS mode.
#delayed-detect: yesprefilter: # default prefiltering setting. "mpm" only creates MPM/fast_pattern # engines. "auto" also sets up prefilter engines for other keywords. # Use --list-keywords=all to see which keywords support prefiltering.
default: mpm- the grouping values above control how many groups are created per
- direction. Port whitelisting forces that port to get it's own group.
- Very common ports will benefit, as well as ports with many expensive
- rules.
grouping:
#tcp-whitelist: 53, 80, 139, 443, 445, 1433, 3306, 3389, 6666, 6667, 8080
#udp-whitelist: 53, 135, 5060
profiling: # Log the rules that made it past the prefilter stage, per packet # default is off. The threshold setting determines how many rules # must have made it past pre-filter for that rule to trigger the # logging.
#inspect-logging-threshold: 200
grouping:
dump-to-disk: false
include-rules: false # very verbose
include-mpm-stats: false
- Select the multi pattern algorithm you want to run for scan/search the
- in the engine. #
- The supported algorithms are:
- "ac" - Aho-Corasick, default implementation
- "ac-bs" - Aho-Corasick, reduced memory implementation
- "ac-cuda" - Aho-Corasick, CUDA implementation
- "ac-ks" - Aho-Corasick, "Ken Steele" variant
- "hs" - Hyperscan, available when built with Hyperscan support #
- The default mpm-algo value of "auto" will use "hs" if Hyperscan is
- available, "ac" otherwise. #
- The mpm you choose also decides the distribution of mpm contexts for
- signature groups, specified by the conf - "detect.sgh-mpm-context".
- Selecting "ac" as the mpm would require "detect.sgh-mpm-context"
- to be set to "single", because of ac's memory requirements, unless the
- ruleset is small enough to fit in one's memory, in which case one can
- use "full" with "ac". Rest of the mpms can be run in "full" mode. #
- There is also a CUDA pattern matcher (only available if Suricata was
- compiled with --enable-cuda: b2g_cuda. Make sure to update your
- max-pending-packets setting above as well if you use b2g_cuda.
mpm-algo: auto
- Select the matching algorithm you want to use for single-pattern searches. #
- Supported algorithms are "bm" (Boyer-Moore) and "hs" (Hyperscan, only
- available if Suricata has been built with Hyperscan support). #
- The default of "auto" will use "hs" if available, otherwise "bm".
spm-algo: auto
- Suricata is multi-threaded. Here the threading can be influenced.
threading:
set-cpu-affinity: no # Tune cpu affinity of threads. Each family of threads can be bound # on specific CPUs. # # These 2 apply to the all runmodes: # management-cpu-set is used for flow timeout handling, counters # worker-cpu-set is used for 'worker' threads # # Additionally, for autofp these apply: # receive-cpu-set is used for capture threads # verdict-cpu-set is used for IPS verdict threads #
cpu-affinity:
- management-cpu-set:
cpu: [ 0 ] # include only these cpus in affinity settings
- receive-cpu-set:
cpu: [ 0 ] # include only these cpus in affinity settings
- worker-cpu-set:
cpu: [ "all" ]
mode: "exclusive" # Use explicitely 3 threads and don't compute number by using # detect-thread-ratio variable: # threads: 3
prio:
low: [ 0 ]
medium: [ "1-2" ]
high: [ 3 ]
default: "medium"
#- verdict-cpu-set: # cpu: [ 0 ] # prio: # default: "high" # # By default Suricata creates one "detect" thread per available CPU/CPU core. # This setting allows controlling this behaviour. A ratio setting of 2 will # create 2 detect threads for each CPU/CPU core. So for a dual core CPU this # will result in 4 detect threads. If values below 1 are used, less threads # are created. So on a dual core CPU a setting of 0.5 results in 1 detect # thread being created. Regardless of the setting at a minimum 1 detect # thread will always be created. #
detect-thread-ratio: 1.0
- Luajit has a strange memory requirement, it's 'states' need to be in the
- first 2G of the process' memory. #
- 'luajit.states' is used to control how many states are preallocated.
- State use: per detect script: 1 per detect thread. Per output script: 1 per
- script.
luajit:
states: 128
- Profiling settings. Only effective if Suricata has been built with the
- the --enable-profiling configure flag.
#
profiling: # Run profiling for every xth packet. The default is 1, which means we # profile every packet. If set to 1000, one packet is profiled for every # 1000 received.
#sample-rate: 1000- rule profiling
rules:- Profiling can be disabled here, but it will still have a
- performance impact if compiled in.
enabled: yes
filename: rule_perf.log
append: yes
- Sort options: ticks, avgticks, checks, matches, maxticks
- If commented out all the sort options will be used.
#sort: avgticks
- Limit the number of sids for which stats are shown at exit (per sort).
limit: 10
- output to json
json: yes
- per keyword profiling
keywords:
enabled: yes
filename: keyword_perf.log
append: yes
- per rulegroup profiling
rulegroups:
enabled: yes
filename: rule_group_perf.log
append: yes
- packet profiling
packets:- Profiling can be disabled here, but it will still have a
- performance impact if compiled in.
enabled: yes
filename: packet_stats.log
append: yes
- per packet csv output
csv:- Output can be disabled here, but it will still have a
- performance impact if compiled in.
enabled: no
filename: packet_stats.csv
- profiling of locking. Only available when Suricata was built with
- --enable-profiling-locks.
locks:
enabled: no
filename: lock_stats.log
append: yes
pcap-log:
enabled: no
filename: pcaplog_stats.log
append: yes - rule profiling
- Netfilter integration ##
- When running in NFQ inline mode, it is possible to use a simulated
- non-terminal NFQUEUE verdict.
- This permit to do send all needed packet to suricata via this a rule:
- iptables -I FORWARD -m mark ! --mark $MARK/$MASK -j NFQUEUE
- And below, you can have your standard filtering ruleset. To activate
- this mode, you need to set mode to 'repeat'
- If you want packet to be sent to another queue after an ACCEPT decision
- set mode to 'route' and set next-queue value.
- On linux >= 3.1, you can set batchcount to a value > 1 to improve performance
- by processing several packets before sending a verdict (worker runmode only).
- On linux >= 3.6, you can set the fail-open option to yes to have the kernel
- accept the packet if suricata is not able to keep pace.
- bypass mark and mask can be used to implement NFQ bypass. If bypass mark is
- set then the NFQ bypass is activated. Suricata will set the bypass mark/mask
- on packet of a flow that need to be bypassed. The Nefilter ruleset has to
- directly accept all packets of a flow once a packet has been marked.
nfq: - mode: accept
- repeat-mark: 1
- repeat-mask: 1
- bypass-mark: 1
- bypass-mask: 1
- route-queue: 2
- batchcount: 20
- fail-open: yes
#nflog support
nflog:
# netlink multicast group
# (the same as the iptables --nflog-group param)
# Group 0 is used by the kernel, so you can't use it
- group: 2
# netlink buffer size
buffer-size: 18432
# put default value here
- group: default
# set number of packet to queue inside kernel
qthreshold: 1
# set the delay before flushing packet in the queue inside kernel
qtimeout: 100
# netlink max buffer size
max-size: 20000
- Advanced Capture Options ##
- general settings affecting packet capture
capture: # disable NIC offloading. It's restored when Suricata exists. # Enabled by default
#disable-offloading: false # # disable checksum validation. Same as setting '-k none' on the # commandline
#checksum-validation: none
- Netmap support #
- Netmap operates with NIC directly in driver, so you need FreeBSD wich have
- built-in netmap support or compile and install netmap module and appropriate
- NIC driver on your Linux system.
- To reach maximum throughput disable all receive-, segmentation-,
- checksum- offloadings on NIC.
- Disabling Tx checksum offloading is required for connecting OS endpoint
- with NIC endpoint.
- You can find more information at https://github.com/luigirizzo/netmap
#
netmap: # To specify OS endpoint add plus sign at the end (e.g. "eth0+")
- interface: eth0 # Number of receive threads. "auto" uses number of RSS queues on interface.
#threads: auto # You can use the following variables to activate netmap tap or IPS mode. # If copy-mode is set to ips or tap, the traffic coming to the current # interface will be copied to the copy-iface interface. If 'tap' is set, the # copy is complete. If 'ips' is set, the packet matching a 'drop' action # will not be copied. # To specify the OS as the copy-iface (so the OS can route packets, or forward # to a service running on the same machine) add a plus sign at the end # (e.g. "copy-iface: eth0+"). Don't forget to set up a symmetrical eth0+ -> eth0 # for return packets. Hardware checksumming must be off on the interface if # using an OS endpoint (e.g. 'ifconfig eth0 -rxcsum -txcsum -rxcsum6 -txcsum6' for FreeBSD # or 'ethtool -K eth0 tx off rx off' for Linux).
#copy-mode: tap
#copy-iface: eth3 # Set to yes to disable promiscuous mode # disable-promisc: no # Choose checksum verification mode for the interface. At the moment # of the capture, some packets may be with an invalid checksum due to # offloading to the network card of the checksum computation. # Possible values are: # - yes: checksum validation is forced # - no: checksum validation is disabled # - auto: suricata uses a statistical approach to detect when # checksum off-loading is used. # Warning: 'checksum-validation' must be set to yes to have any validation
#checksum-checks: auto # BPF filter to apply to this interface. The pcap filter syntax apply here.
#bpf-filter: port 80 or udp
#- interface: eth3
#threads: auto
#copy-mode: tap
#copy-iface: eth2 # Put default values here
- interface: default
- PF_RING configuration. for use with native PF_RING support
- for more info see http://www.ntop.org/products/pf_ring/
pfring:
- interface: p4p2 # Number of receive threads (>1 will enable experimental flow pinned # runmode)
threads: 16- Default clusterid. PF_RING will load balance packets based on flow.
# All threads/processes that will participate need to have the same
# clusterid.
cluster-id: 99 - Second interface
#- interface: p4p2 - threads: 3
- cluster-id: 93
- cluster-type: cluster_flow
- Put default values here
- interface: p4p2
#threads: 2
- Default PF_RING cluster type. PF_RING can load balance per flow.
- Possible values are cluster_flow or cluster_round_robin.
cluster-type: cluster_flow - bpf filter for this interface
#bpf-filter: tcp - Choose checksum verification mode for the interface. At the moment
- of the capture, some packets may be with an invalid checksum due to
- offloading to the network card of the checksum computation.
- Possible values are:
- - rxonly: only compute checksum for packets received by network card.
- - yes: checksum validation is forced
- - no: checksum validation is disabled
- - auto: suricata uses a statistical approach to detect when
- checksum off-loading is used. (default)
- Warning: 'checksum-validation' must be set to yes to have any validation
#checksum-checks: auto
- Default clusterid. PF_RING will load balance packets based on flow.
# All threads/processes that will participate need to have the same
# clusterid.
- For FreeBSD ipfw(8) divert(4) support.
- Please make sure you have ipfw_load="YES" and ipdivert_load="YES"
- in /etc/loader.conf or kldload'ing the appropriate kernel modules.
- Additionally, you need to have an ipfw rule for the engine to see
- the packets from ipfw. For Example: #
- ipfw add 100 divert 8000 ip from any to any #
- The 8000 above should be the same number you passed on the command
- line, i.e. -d 8000
#
ipfw:- Reinject packets at the specified ipfw rule number. This config
- option is the ipfw rule number AT WHICH rule processing continues
- in the ipfw processing system after the engine has finished
- inspecting the packet for acceptance. If no rule number is specified,
- accepted packets are reinjected at the divert rule which they entered
- and IPFW rule processing continues. No check is done to verify
- this will rule makes sense so care must be taken to avoid loops in ipfw.
#
- The following example tells the engine to reinject packets
- back into the ipfw firewall AT rule number 5500: #
- ipfw-reinjection-rule-number: 5500
napatech:
# The Host Buffer Allowance for all streams
# (-1 = OFF, 1 - 100 = percentage of the host buffer that can be held back)
# This may be enabled when sharing streams with another application.
# Otherwise, it should be turned off.
hba: -1
- use_all_streams set to "yes" will query the Napatech service for all configured
- streams and listen on all of them. When set to "no" the streams config array
- will be used.
use-all-streams: yes
- The streams to listen on. This can be either:
- a list of individual streams (e.g. streams: [0,1,2,3])
- or
- a range of streams (e.g. streams: ["0-3"])
streams: ["0-3"]
- Tilera mpipe configuration. for use on Tilera TILE-Gx.
mpipe:- Load balancing modes: "static", "dynamic", "sticky", or "round-robin".
load-balance: dynamic
- Number of Packets in each ingress packet queue. Must be 128, 512, 2028 or 65536
iqueue-packets: 2048
- List of interfaces we will listen on.
inputs:
- interface: xgbe2
- interface: xgbe3
- interface: xgbe4
- Relative weight of memory for packets of each mPipe buffer size.
stack:
size128: 0
size256: 9
size512: 0
size1024: 0
size1664: 7
size4096: 0
size10386: 0
size16384: 0
- Load balancing modes: "static", "dynamic", "sticky", or "round-robin".
- Hardware accelaration ##
- Cuda configuration.
cuda: # The "mpm" profile. On not specifying any of these parameters, the engine's # internal default values are used, which are same as the ones specified in # in the default conf file.
mpm: # The minimum length required to buffer data to the gpu. # Anything below this is MPM'ed on the CPU. # Can be specified in kb, mb, gb. Just a number indicates it's in bytes. # A value of 0 indicates there's no limit.
data-buffer-size-min-limit: 0 # The maximum length for data that we would buffer to the gpu. # Anything over this is MPM'ed on the CPU. # Can be specified in kb, mb, gb. Just a number indicates it's in bytes.
data-buffer-size-max-limit: 1500 # The ring buffer size used by the CudaBuffer API to buffer data.
cudabuffer-buffer-size: 500mb # The max chunk size that can be sent to the gpu in a single go.
gpu-transfer-size: 50mb # The timeout limit for batching of packets in microseconds.
batching-timeout: 2000 # The device to use for the mpm. Currently we don't support load balancing # on multiple gpus. In case you have multiple devices on your system, you # can specify the device to use, using this conf. By default we hold 0, to # specify the first device cuda sees. To find out device-id associated with # the card(s) on the system run "suricata --list-cuda-cards".
device-id: 0 # No of Cuda streams used for asynchronous processing. All values > 0 are valid. # For this option you need a device with Compute Capability > 1.0.
cuda-streams: 2
- Include other configs ##
- Includes. Files included here will be handled as if they were
- inlined in this configuration file.
#include: include1.yaml
#include: include2.yaml
----------------------------------end
start cmd:
start:
pfring mode
/usr/local/suricata4.0.7/bin/suricata --pfring-int=p4p2 --pfring-cluster-id=99 --pfring-cluster-type=cluster_flow -c /usr/local/suricata4.0.7/etc/suricata/suricata.yaml
and i also tried afpacket mode
/usr/local/suricata4.0.7/bin/suricata --runmode workers --af-packet=p4p2 -c /usr/local/suricata4.0.7/etc/suricata/suricata.yaml
YL Updated by yg lu almost 7 years ago
my test method is
capture a http request and repeat several times, all the repeat got success response, and the web server received the access messages.
but suricata can't capture all my requests. sometimes lost a little requests, sometime lost almost the requests.
YL Updated by yg lu almost 7 years ago
btw: i use network span to capture traffic
AH Updated by Andreas Herz almost 7 years ago
I'm still not 100% sure what you're doing. You have this traffic running and the machine with suricata is attached to the span port?
How do you determine that suricata didn't see the requests?
Do you see other requests?
Can you try a small portion of traffic and check if you see it with tcpdump on the same machine as suricata and also if you can see it within suricata.
A stats.log output might be helpful as well.
YL Updated by yg lu almost 7 years ago
my test method
1. span the network traffic to my machine p4p2 nic
2. start suricata monitor p4p2 port
cmd:
/usr/local/suricata4.0.7/bin/suricata --pfring-int=p4p2 --pfring-cluster-id=99 --pfring-cluster-type=cluster_flow -c /usr/local/suricata4.0.7/etc/suricata/suricata.yaml
3. i write a test rule which is suricata only load's rule , it's only for test
4. when i start suricata , i also start tcpdump to monitor p4p2
5. i send request from my pc, which is the rule suricata loads, it is for test suricata can catch it , if match it will write log to eve.log
6. finally ,when i stop capture, suricata tells me 0 drop, and then i 'll test whether suricata and tcpdump catch my all test traffice; actually i test such as 10 requests, tcpdump can catch all, but suricata can not.
u could see my snaps above
i don't know why , it worried me for 2 weeks. please help
YL Updated by yg lu almost 7 years ago
- File networkpic.png networkpic.png added
i draw my network pic !!
YL Updated by yg lu almost 7 years ago
i found my problem
suricata.yaml
vlan:
use-for-tracking: true
change true to false
VJ Updated by Victor Julien almost 7 years ago
- Status changed from Feedback to Closed
Glad you found the issue!