Bug #5071
openSuricata RAM usage never decreasing
Description
Good afternoon,
currently I am working with Suricata 6.0.4 and I've stumbled on this issue that I do not understand. Whenever Suricata inspect traffic, depending on the magnitude of the traffic to be analyzed, the RAM usage increase. This is obviously fine, the issue is that even after hours in which no traffic or a lower amount is being analyzed, the RAM usage is still the same. It seems like memory is not being deallocated.
What I am experiencing is the same as: https://redmine.openinfosecfoundation.org/issues/3679
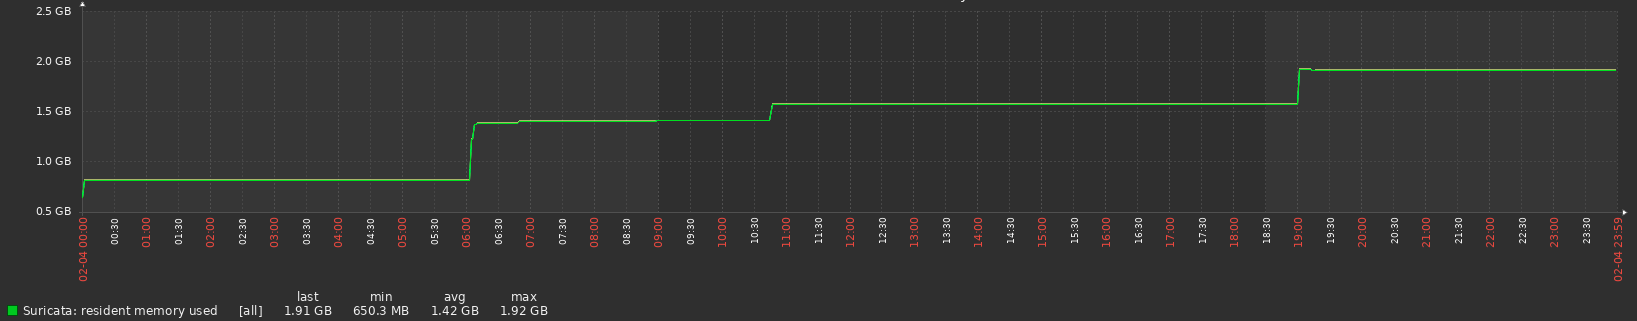
I've attached an image of this behavior. In that case the memory used always increases even though during the day there isn't the same amount of traffic to be analyzed.
Every midnight Suricata is restarted so the memory starts around ~700MB more or less.
Files
LC Updated by Luca Cigarini over 4 years ago
- File suricata_test_trex_with_signatures_traffic.png suricata_test_trex_with_signatures_traffic.png added
- File suricata_test_trex_with_signature_memory_usage.png suricata_test_trex_with_signature_memory_usage.png added
- File suricata_behavior_no_signatures_traffic.png suricata_behavior_no_signatures_traffic.png added
- File suricata_behavior_no_signatures_memory_usage.png suricata_behavior_no_signatures_memory_usage.png added
I've run another set of tests and the same issue occurred.
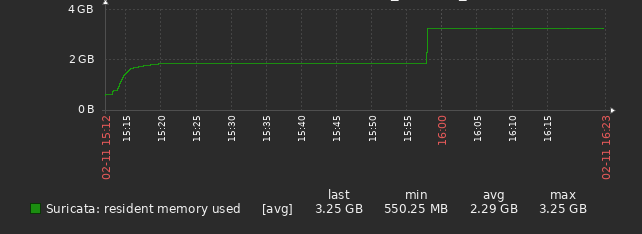
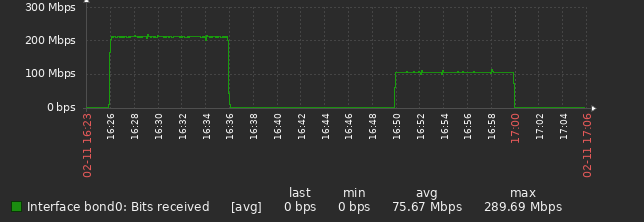
In the first two screenshots I've run six tests with TRex. Four tests with a mix of licit and malicious traffic at 200 Mb/s and the last two with only dns traffic at 200 Mb/s. Each test was 10 minutes long. As you can see memory usage increased during the time of the tests.
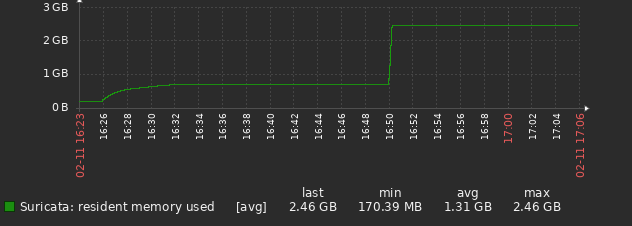
I've tried to do another couple of tests disabling the rule file to see if something changed, but as you can see even 5 minutes after the end of the tests still no signs of memory decrease.
I'm using this config:
af-packet:
- interface: bond0
threads: 3
cluster-id: 1
cluster-type: cluster_flow
defrag: yes
use-mmap: yes
tpacket-v3: yes
ring-size: 10000
buffer-size: 65535
disable-promisc: no
checksum-checks: kernel
runmode: workers
max-pending-packets: 10000
default-packet-size: 1514
defrag:
memcap: 32mb
hash-size: 65536
trackers: 65535
max-frags: 65535
prealloc: yes
timeout: 60
flow:
memcap: 512mb
hash-size: 65536
prealloc: 50000
emergency-recovery: 30
flow-timeouts:
default:
new: 30
established: 300
closed: 0
bypassed: 100
emergency-new: 10
emergency-established: 100
emergency-closed: 0
emergency-bypassed: 50
tcp:
new: 60
established: 600
closed: 15
bypassed: 100
emergency-new: 5
emergency-established: 100
emergency-closed: 0
emergency-bypassed: 50
udp:
new: 30
established: 300
bypassed: 100
emergency-new: 10
emergency-established: 100
emergency-bypassed: 50
icmp:
new: 30
established: 300
bypassed: 100
emergency-new: 10
emergency-established: 100
emergency-bypassed: 50
stream:
memcap: 512mb
checksum-validation: no # do not reject wrong csums
inline: auto # auto will use inline mode in IPS mode, yes or no set it statically
prealloc-sessions: 2000
reassembly:
memcap: 3096mb
segment-prealloc: 10000
depth: 1mb # reassemble 1mb into a stream
toserver-chunk-size: 2560
toclient-chunk-size: 2560
randomize-chunk-size: yes
Also I'm using tcmalloc
Concerning the system I'm using:
Ubuntu 20.04 kernel: 5.13.0-28-generic
RAM: 16 GB
Architecture: x86_64
CPU op-mode(s): 32-bit, 64-bit
Byte Order: Little Endian
Address sizes: 36 bits physical, 48 bits virtual
CPU: 8
On-line CPU list: 0-7
Thread(s) per core: 2
Core(s) per socket: 4
Socket(s): 1
NUMA node(s): 1
Vendor ID: GenuineIntel
CPU family: 6
Model: 58
Model name: Intel(R) Core(TM) i7-3612QE CPU @ 2.10GHz
Stepping: 9
CPU MHz: 2000.000
CPU max MHz: 3100.0000
CPU min MHz: 1200.0000
BogoMIPS: 4200.11
L1d cache: 128 KiB
L1i cache: 128 KiB
L2 cache: 1 MiB
L3 cache: 6 MiB
NUMA node0 CPU: 0-7
PA Updated by Philippe Antoine about 1 year ago
- Status changed from New to Feedback
Is this still a problem in Suricata 8 ?