Bug #4187
closedrs_dcerpc_udp_get_tx takes out unusual amount of CPU
Description
I noticed something unusual while chasing https://redmine.openinfosecfoundation.org/issues/4080
It seems rs_dcerpc_udp_get_tx keeps every thread busy with about 0.5-2.5% of the total CPU, which seems a lot for a function like that.
(was having side discussion with Eric about it too)
Please see the Flame Graph (svg) attached as well for a 12 hr run.
The purple squares in the screenshot attached are from the rs_dcerpc_udp_get_tx function.
Using:
 /opt/suritest-tmp/bin/suricata --build-info
This is Suricata version 6.0.1-dev (f3c59ef8a 2020-12-01)
Features: PCAP_SET_BUFF AF_PACKET HAVE_PACKET_FANOUT LIBCAP_NG LIBNET1.1 HAVE_HTP_URI_NORMALIZE_HOOK PCRE_JIT HAVE_NSS HAVE_LUA HAVE_LUAJIT HAVE_LIBJANSSON TLS TLS_C11 MAGIC RUST
SIMD support: SSE_4_2 SSE_4_1 SSE_3
Atomic intrinsics: 1 2 4 8 16 byte(s)
64-bits, Little-endian architecture
GCC version 4.2.1 Compatible Clang 7.0.1 (tags/RELEASE_701/final), C version 201112
compiled with _FORTIFY_SOURCE=0
L1 cache line size (CLS)=64
thread local storage method: _Thread_local
compiled with LibHTP v0.5.35, linked against LibHTP v0.5.35

Suricata Configuration:
  AF_PACKET support:                       yes
  eBPF support:                            yes
  XDP support:                             yes
  PF_RING support:                         no
  NFQueue support:                         no
  NFLOG support:                           no
  IPFW support:                            no
  Netmap support:                          no
  DAG enabled:                             no
  Napatech enabled:                        no
  WinDivert enabled:                       no

  Unix socket enabled:                     yes
  Detection enabled:                       yes

  Libmagic support:                        yes
  libnss support:                          yes
  libnspr support:                         yes
  libjansson support:                      yes
  hiredis support:                         no
  hiredis async with libevent:             no
  Prelude support:                         no
  PCRE jit:                                yes
  LUA support:                             yes, through luajit
  libluajit:                               yes
  GeoIP2 support:                          yes
  Non-bundled htp:                         no
  Hyperscan support:                       yes
  Libnet support:                          yes
  liblz4 support:                          yes

  Rust support:                            yes
  Rust strict mode:                        yes
  Rust compiler path:                      /root/.cargo/bin/rustc
  Rust compiler version:                   rustc 1.48.0 (7eac88abb 2020-11-16)
  Cargo path:                              /root/.cargo/bin/cargo
  Cargo version:                           cargo 1.48.0 (65cbdd2dc 2020-10-14)
  Cargo vendor:                            yes

  Python support:                          yes
  Python path:                             /usr/bin/python3
  Python distutils                         yes
  Python yaml                              yes
  Install suricatactl:                     yes
  Install suricatasc:                      yes
  Install suricata-update:                 not bundled

  Profiling enabled:                       no
  Profiling locks enabled:                 no

  Plugin support (experimental):           yes

Development settings:
  Coccinelle / spatch:                     no
  Unit tests enabled:                      no
  Debug output enabled:                    no
  Debug validation enabled:                no

Generic build parameters:
  Installation prefix:                     /opt/suritest-tmp
  Configuration directory:                 /opt/suritest-tmp/etc/suricata/
  Log directory:                           /opt/suritest-tmp/var/log/suricata/

  --prefix                                 /opt/suritest-tmp
  --sysconfdir                             /opt/suritest-tmp/etc
  --localstatedir                          /opt/suritest-tmp/var
  --datarootdir                            /opt/suritest-tmp/share

  Host:                                    x86_64-pc-linux-gnu
  Compiler:                                clang (exec name) / g++ (real)
  GCC Protect enabled:                     no
  GCC march native enabled:                yes
  GCC Profile enabled:                     no
  Position Independent Executable enabled: no
  CFLAGS                                   -ggdb3 -O0  -Wchar-subscripts -Wshadow -Wall -Wextra -Wno-unused-parameter -Wno-unused-function -Wno-unused-parameter -Wno-unused-function  -std=c11 -march=native -I${srcdir}/../rust/gen -I${srcdir}/../rust/dist
  PCAP_CFLAGS                               -I/usr/include
  SECCFLAGS
Files
PM Updated by Peter Manev over 5 years ago
- File Screenshot from 2020-12-02 23-41-52.png Screenshot from 2020-12-02 23-41-52.png added
- File Screenshot from 2020-12-02 23-41-52.png added
Another perf top attempt to trace (attached)
PM Updated by Peter Manev over 5 years ago
- File deleted (
Screenshot from 2020-12-02 23-41-52.png)
PM Updated by Peter Manev over 5 years ago
- Affected Versions git main added
SB Updated by Shivani Bhardwaj over 5 years ago
- Status changed from New to Assigned
- Assignee set to Shivani Bhardwaj
- Target version set to 7.0.0-beta1
PM Updated by Peter Manev over 5 years ago
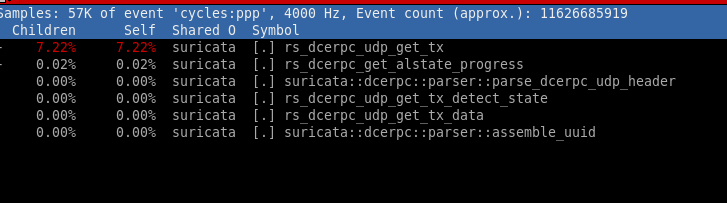
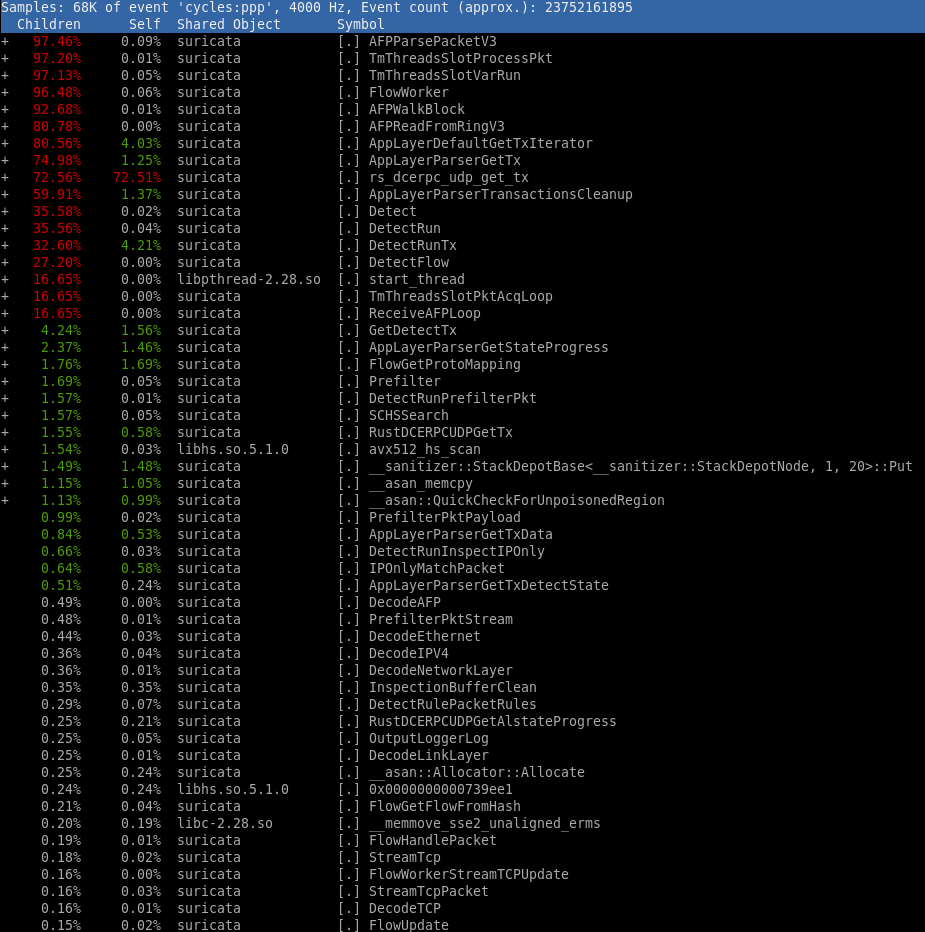
On certain CPUs i can observe the following:
SB Updated by Shivani Bhardwaj over 5 years ago
- Priority changed from Normal to High
PM Updated by Peter Manev over 5 years ago
It does not seem related to traditional ports traffic for dcerpc.
When the traditional dcerpc ports are negated, what is left is very few dcerpc logs per second - really low - it could be 40-50 events per minute.
Interesting observation is that the performance hit is related to a number of specific events appearing.
So the percentage of the function (rs_dcerpc_udp_get_tx) usage goes up and down and disappears with time and only climbs up after seeing a few - 5/15 "UNREPLIED" responses. The performance hit can be up to 70% of that thread usage it seems.
Example:
{"timestamp":"2021-02-04T00:28:49.287610+0100","flow_id":126330399730600,"in_iface":"abcd","event_type":"dcerpc","vlan":[222],"src_ip":"x.x.x.x","src_port":51820,"dest_ip":"y.y.y.y","dest_port":61056,"proto":"UDP","dcerpc":{"request":"REQUEST","req":{"opnum":0,"frag_cnt":1,"stub_data_size":63},"response":"UNREPLIED","activityuuid":"2cfa693a-298c-cee2-7c09-ebbd4a5a474e","seqnum":15733106,"rpc_version":"4.0"}}
pcap shared privately.
SB Updated by Shivani Bhardwaj over 5 years ago
- Status changed from Assigned to Closed
Closed by: https://github.com/OISF/suricata/pull/5891
SB Updated by Shivani Bhardwaj over 5 years ago
- Label Needs backport to 6.0 added
SB Updated by Shivani Bhardwaj over 5 years ago
- Copied to Bug #4353: rs_dcerpc_udp_get_tx takes out unusual amount of CPU added