Support #2476
closedEve-log output data
Description
I have compiled suricata with netmap as well as pf_ring. When i tried both capture mode surprisingly with same other configurations their eve-log output is lot different. PF_Ring eve-log output is appx 10x than netmap.
RSS value in both case is 1.
eve-log output to redis list.
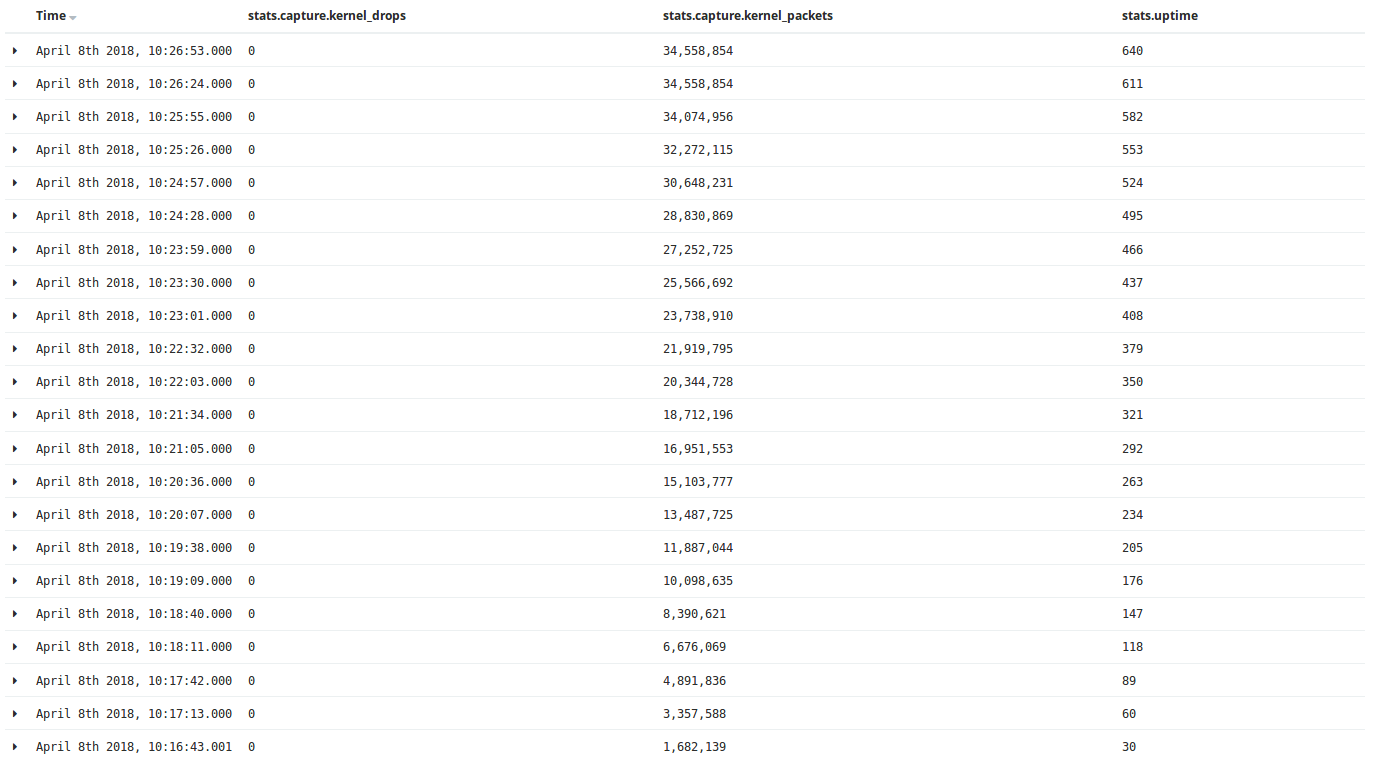
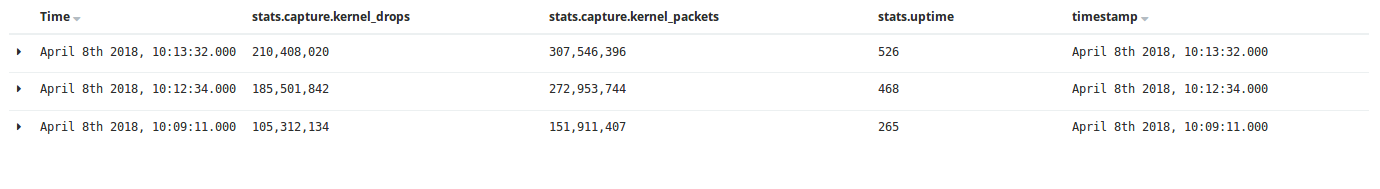
eve-log output stats.capture.kernel_drop value is zero in case of netmap while in case of pf_ring value is greater than 1.
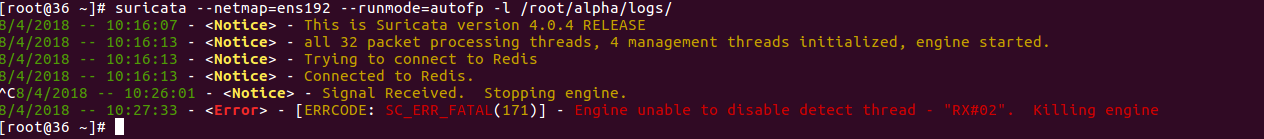
After engine stopped, PF_Ring stats says drop percentage is appx. 40% with data rate 5-10gbps, while in case of netmap i got an errorERRCODE: S_ERROR_FATAL(171) Engine unable to disable to detect thread - 'w#02-ens192' killing engine
Can anybody help me what i am doing wrong?
Files
VJ Updated by Victor Julien over 8 years ago
- Target version deleted (
4.0.4)
AH Updated by Andreas Herz over 8 years ago
- Assignee set to Anonymous
- Target version set to Support
Can you add more details about your setup, just with those informations it will be just a wild guessing.
RS Updated by Ron Smith over 8 years ago
- File eve_output.png eve_output.png added
- File netmap_capture_stats.png netmap_capture_stats.png added
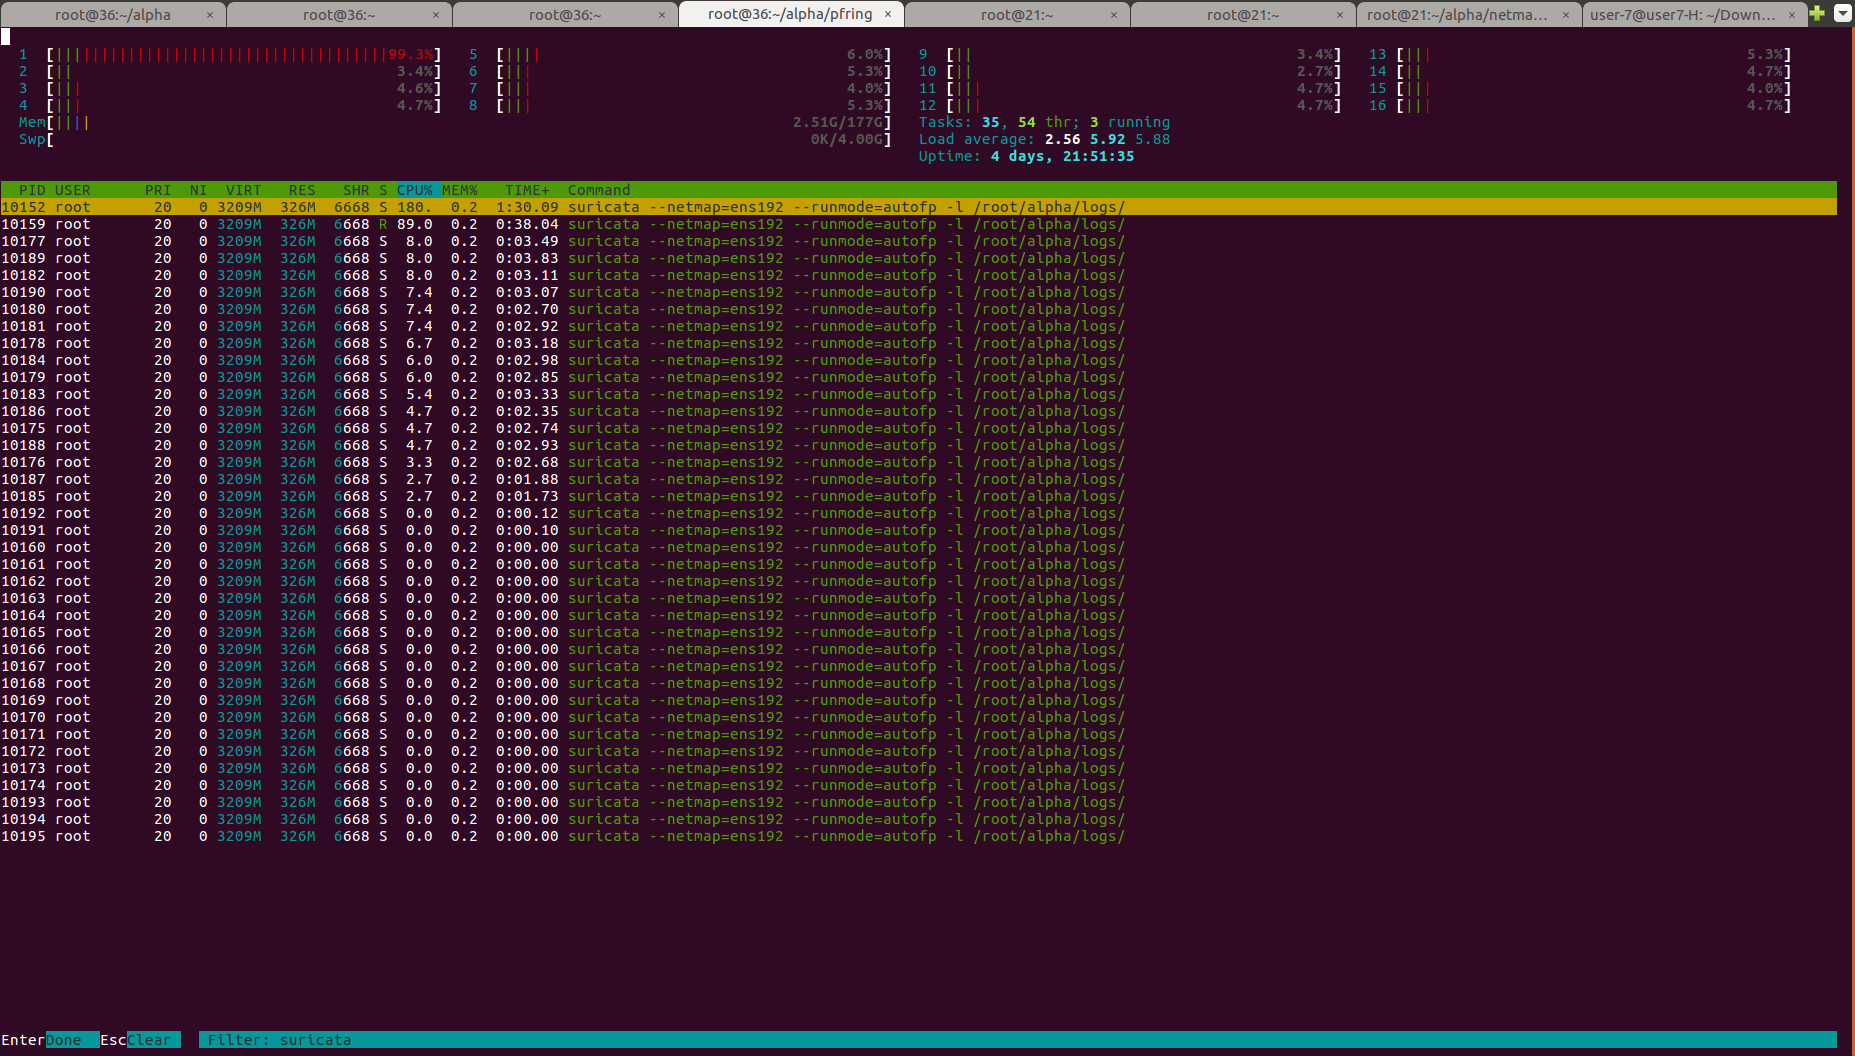
- File netmap_cpu.png netmap_cpu.png added
- File netmap_exit.png netmap_exit.png added
- File pf_ring_capture_stats.png pf_ring_capture_stats.png added
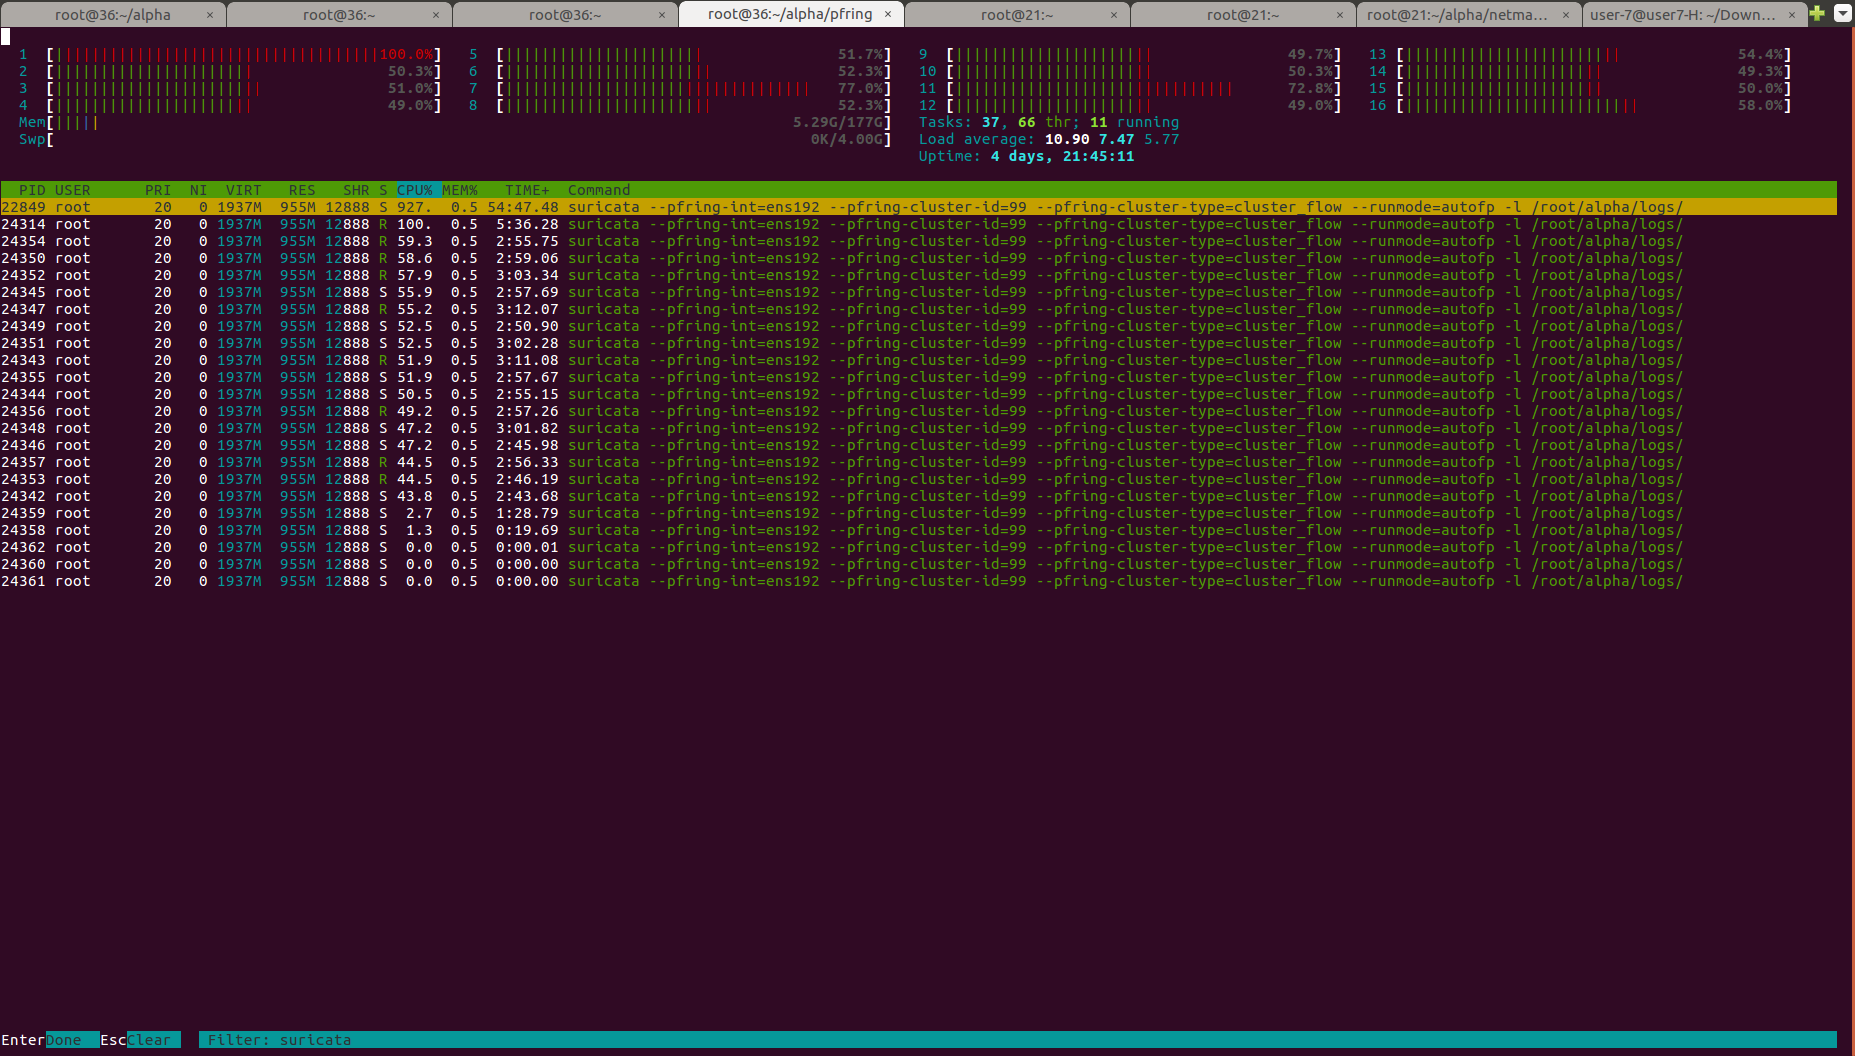
- File pf_ring_cpu.png pf_ring_cpu.png added
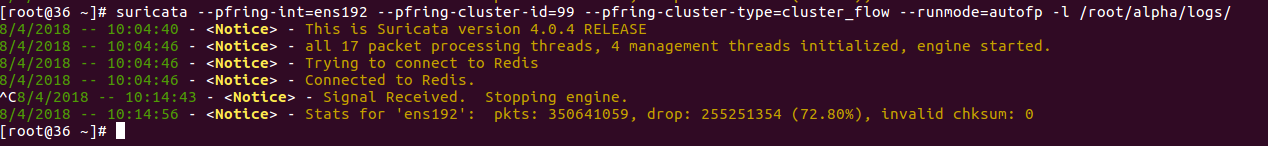
- File pf_ring_exit.png pf_ring_exit.png added
- File suricata.yaml suricata.yaml added
- File suricata_build_info.txt suricata_build_info.txt added
I am putting 10min screenshots/observations of pf_ring and netmap capture modes.
PF_RING cmd -> suricata --pfring-int=ens192 --pfring-cluster-id=99 --pfring-cluster-type=cluster_flow --runmod=autofp -l /root/alpha/logs/
Netmap cmd -> suricata --netmap=ens192 --runmode=autofp -l /root/alpha/logs
PF_RING Vs Netmap
PF_RING Netmap
CPU High Low
pkt_loss High Zero
Suricata Exit Success Error
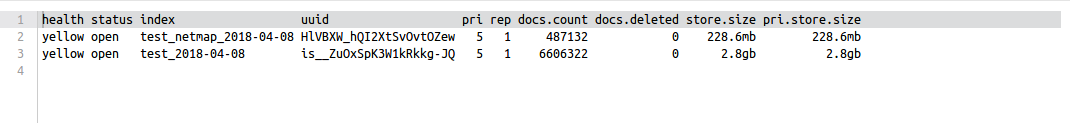
Eve Output docs 6606322 487132
RS Updated by Ron Smith over 8 years ago
Can anybody help me on this
1. First i like to resolve this error throw by suricata while exit when runmode is netmap
cmd -> suricata --netmap=ens192 --runmode=autofp -l /root/alpha/logs
error -> ERRCODE: S_ERROR_FATAL(171) Engine unable to disable to detect thread - 'w#02-ens192' killing engine
PM Updated by Peter Manev over 8 years ago
How do you run those tests with the different methods (pfring/netmap) - is it a tcpreplay/breakingpoint/live traffic etc..
What OS do you use?
In the case of netmap you mention your eve.json is 10x bigger - what makes the difference? (aka 10x more alerts or HTTP reqs or something else?)
RS Updated by Ron Smith over 8 years ago
Peter Manev wrote:
How do you run those tests with the different methods (pfring/netmap) - is it a tcpreplay/breakingpoint/live traffic etc..
What OS do you use?
In the case of netmap you mention your eve.json is 10x bigger - what makes the difference? (aka 10x more alerts or HTTP reqs or something else?)
1. Traffic - I perform both test on live traffic(span port) with packet rate 1Mpps(appx).
2. OS - Centos 7, Linux kernel - 3.10.0.693.11.6
3. pfring eve.json is 10x bigger than netmap.(i have enabled everything alert, http, tls, dns(request only),flow, etc - check yaml file). In both case yaml file and traffic rate is same, still every time eve.json of pfring is 10x-15x bigger.
PM Updated by Peter Manev over 8 years ago
Looking at the CPU screenshots - it seems the netmap run is pegging the first cpu while the rest are not so busy ?
I didnt understand (sorry) - what makes up for the difference of the logs - in the log. If you break it down is it more of everything or just more (for example) http/dns logs? Then you can potentially compare the results/stats to a pcap read of the same traffic pcaps you replayed - it may give you a better hint.
I think one possibility that you are getting the err below when doing live replay
Engine unable to disable to detect thread - 'w#02-ens192' killing engine
since there is no more traffic replayed when you stop the engine - if you keep replaying it should behave differently I believe (since potentially there a lot of flows that need to timeout/be shutdown etc..).
VJ Updated by Victor Julien over 7 years ago
- Status changed from New to Closed