Optimization #3637
closedPerformance impact of Cisco Fabricpath
Description
At some setups we see Cisco Fabricpath Traffic (ethertype 0x8903) that results in rather high drop rates even though the traffic is not responsible for much load. With a bpf filter to that protocol the issue was gone.
Files
VJ Updated by Victor Julien over 6 years ago
Do you have more info about what you're seeing? Any decoder events, perf stats, etc?
AH Updated by Andreas Herz over 6 years ago
- File 813_a.txt 813_a.txt added
- File 813_b.txt 813_b.txt added
- File d11_a.txt d11_a.txt added
- File d11_b.txt d11_b.txt added
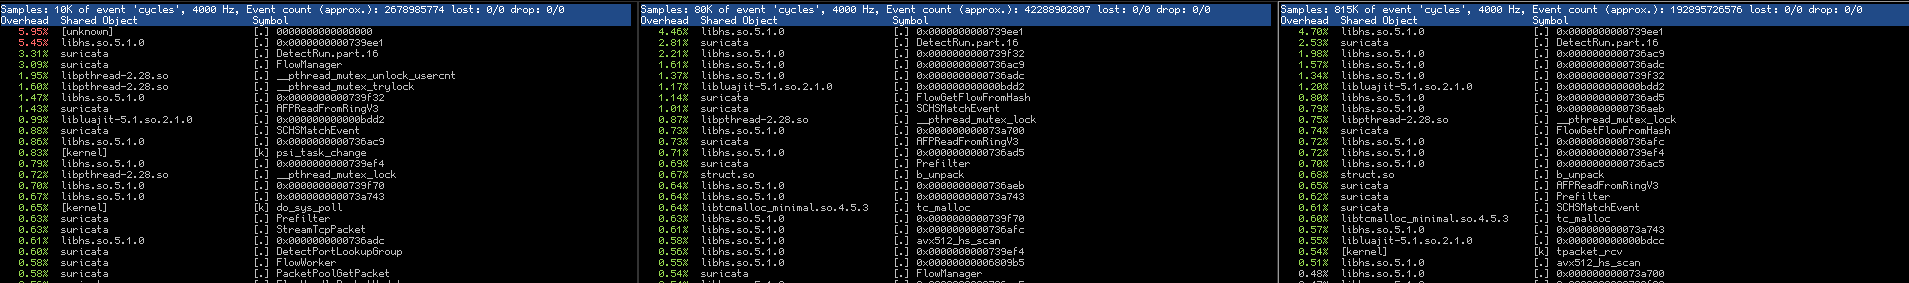
- File perftop.png perftop.png added
Two systems with no filter active (case a) and bpf filter active (case b). Also a perf top from those machines running without the bpf filter. The left one is another machine with low traffic and not that much traffic at all but quite some amount of it being cisco fabric path.
PM Updated by Peter Manev over 6 years ago
Out of curiosity - any chance of knowing whats the "unknown" function on top of the leftmost pertop?
AH Updated by Andreas Herz over 6 years ago
Peter Manev wrote in #note-3:
Out of curiosity - any chance of knowing whats the "unknown" function on top of the leftmost pertop?
I didn't had a change to find it yet, when I zoom in I see nothing. I agree that this is rather strange.
PM Updated by Peter Manev over 6 years ago
Btw - there are some functions/calls that can be unknown , just havn't seen an "unknown" with so high usage - was my point.
PA Updated by Philippe Antoine about 3 years ago
- Status changed from New to In Review
- Assignee set to Philippe Antoine
- Target version changed from TBD to 8.0.0-beta1
PA Updated by Philippe Antoine about 3 years ago
- Target version changed from 8.0.0-beta1 to 7.0.1
PA Updated by Philippe Antoine about 3 years ago
- Priority changed from Low to Normal
PA Updated by Philippe Antoine about 3 years ago
- Label Needs backport, Needs backport to 6.0 added
VJ Updated by Victor Julien almost 3 years ago
- Status changed from In Review to Resolved
OT Updated by OISF Ticketbot almost 3 years ago
- Subtask #6229 added
OT Updated by OISF Ticketbot almost 3 years ago
- Label deleted (
Needs backport, Needs backport to 6.0)
VJ Updated by Victor Julien almost 3 years ago
- Status changed from Resolved to Closed
VJ Updated by Victor Julien almost 3 years ago
- Related to Bug #6394: Sudden increase in capture.kernel_drops and tcp.pkt_on_wrong_thread after upgrading to 6.0.14 added