Bug #4096
closedflow manager: 200% CPU in KVM host with no activity with Suricata 6
Description
An ubuntu 20.04 server was upgraded using the suricata PPA. CPU utilisation with activity
suricata:
Installed: 6.0.0-0ubuntu2
Candidate: 6.0.0-0ubuntu2
Version table:
*** 6.0.0-0ubuntu2 500
500 http://ppa.launchpad.net/oisf/suricata-stable/ubuntu focal/main amd64 Packages
100 /var/lib/dpkg/status
Files
AW Updated by Andrew Welham over 5 years ago
I've just noticed another server , same OS build different h/w architecture one AMD one Intel.
restored to a backup of
apt-cache policy suricata
suricata:
Installed: 5.0.3-0ubuntu0
Candidate: 5.0.3-0ubuntu0
Version table:
*** 5.0.3-0ubuntu0 500
500 http://ppa.launchpad.net/oisf/suricata-stable/ubuntu focal/main amd64 Packages
100 /var/lib/dpkg/status
and put apt upgraded on hold for suricata
I don't have any other information nothing special in the standards logs, happy to provide more info if required, and you let me know what your looking for
AW Updated by Andrew Welham over 5 years ago
Just noticed a few typos in the subject it should read
Ubuntu 20.04 PPA upgraded to Suricata 6 now @ 200% CPU with no activity
AW Updated by Andrew Welham over 5 years ago
Not sure if this helps, suricata is hosted on KVM virtual machines, and the virtual hosts does not look to have high CPU, just the KVM host. The CPU on the KVM host drops dramatically when suricata is stopped.
If i upgrade from v5 to v6 via apt as soon as suricata is restarted on v6 after the upgrade the CPU on the kvm host jumps.
PM Updated by Peter Manev over 5 years ago
Do you mind sharing a screenshot of htop when 6.0 is running and also suricata.log/stats.log files ?
PM Updated by Peter Manev over 5 years ago
- Subject changed from Ubuntu 20.04 PPS upgraded to Suricata 6 now @ 2000% CPU with no activity to Ubuntu 20.04 PPS upgraded to Suricata 6 now @ 200% CPU with no activity
Updated the subject as requested.
AW Updated by Andrew Welham over 5 years ago
- File KVM Client HTOP.jpg KVM Client HTOP.jpg added
- File KVM Host HTOP.jpg KVM Host HTOP.jpg added
- File stats.log stats.log added
- File suricata.log suricata.log added
Peter Here you go
I did a Fresh install of Ubuntu 20.04 (on a test VM) and it was fully patched
installed suricata
sudo apt-get install software-properties-common
sudo add-apt-repository ppa:oisf/suricata-stable
sudo apt-get update
sudo apt-get install suricata
To start suricata
/usr/bin/suricata -c /etc/suricata/suricata.yaml -q 0 -D
as soon as suricata was started the CPu on the kvm host changed, when suricata was killed he CPU went down again, then when restarted it went back up again.
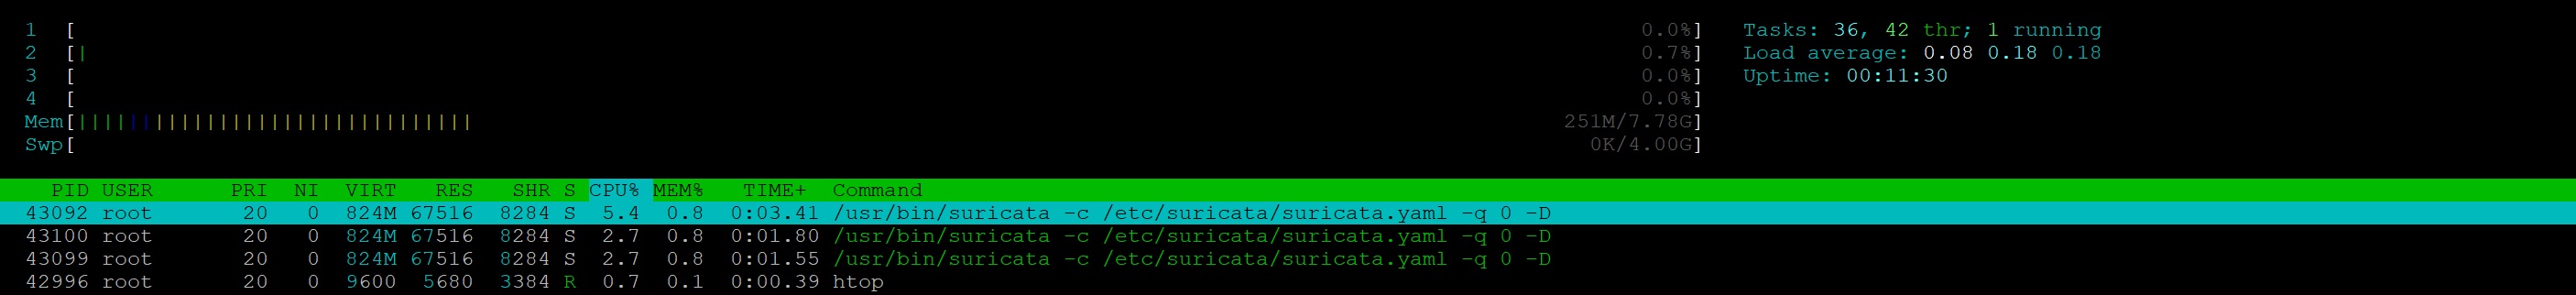
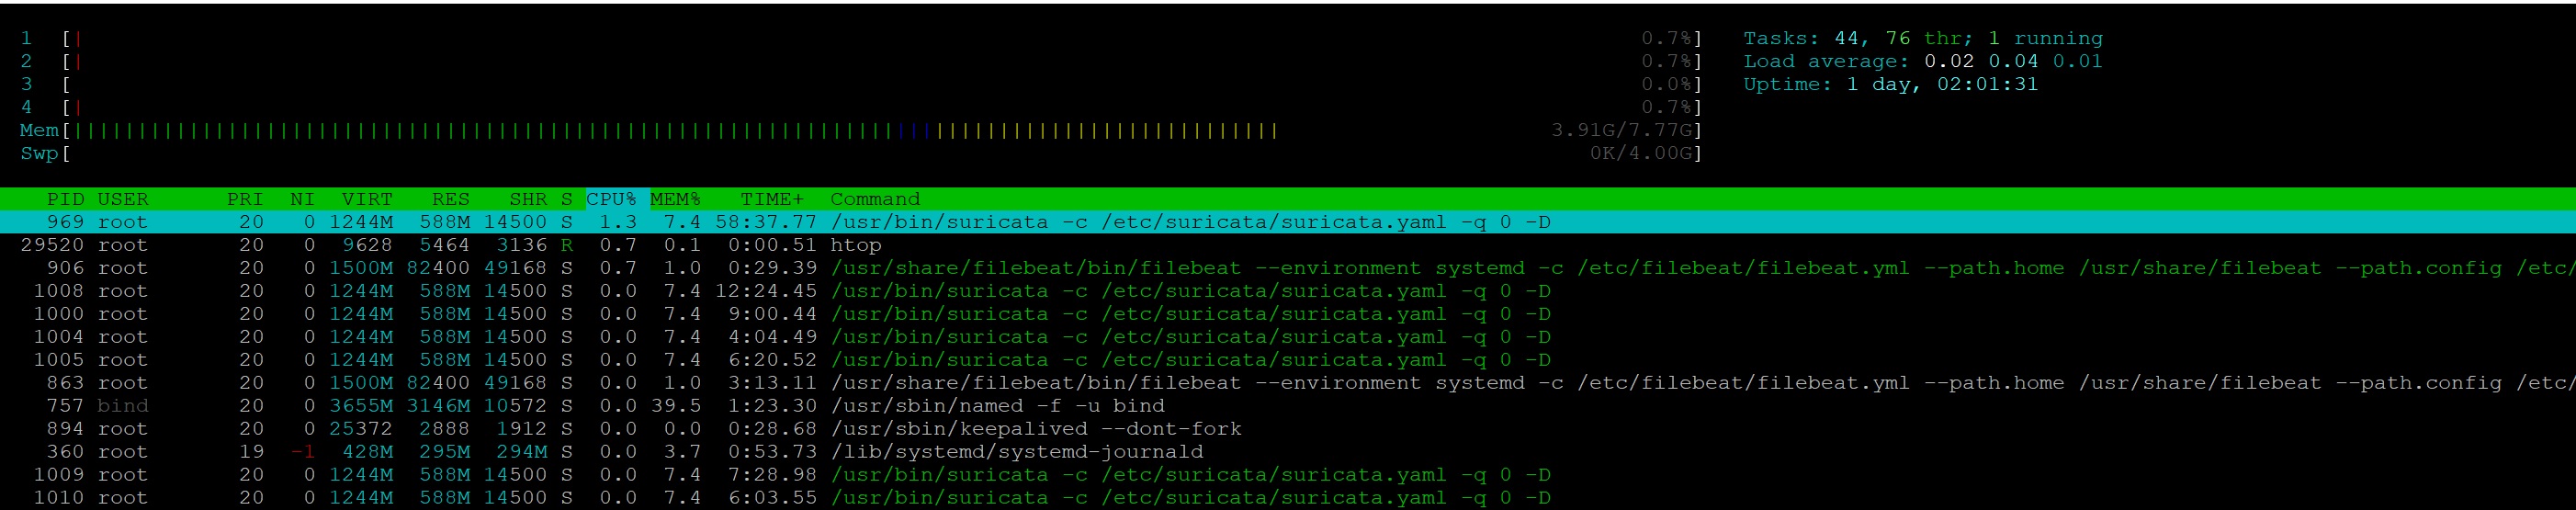
I've attached 2 Htop images
KVM Host HTOP.jpg which is the host used to the the test VM on
KVM Client HTOP.jpt this is the VM running suricata.
Its not a false reading on top or HTOP as the heat output from the hosts increases when suricata is running
No traffic was passed though suricata
VJ Updated by Victor Julien over 5 years ago
- Subject changed from Ubuntu 20.04 PPS upgraded to Suricata 6 now @ 200% CPU with no activity to Ubuntu 20.04 PPA upgraded to Suricata 6 now @ 200% CPU with no activity
PM Updated by Peter Manev over 5 years ago
Just confirming - no traffic and in IPS mode no rules - the KVM host gets busy but not the client, correct?
Does it behave the same in just regular/af-packet/ids mode?
AW Updated by Andrew Welham over 5 years ago
- File Suricata 5 GW.Client.jpg Suricata 5 GW.Client.jpg added
- File Surocata 5 KVM host.jpg Surocata 5 KVM host.jpg added
I don't run suricata in IDS mode, however the screen shots you have seen are on an unconfigured suricata. I just started with the same commands used on the production system. The result though is the same as my production systems.
I wanted to create a repeatable test for the devs. I installed exactly as shown above, no configuration or rules at all.
Happy to start with a different set of commands if you let me the startup commands you want.
As for the CPU utilisation the client appears ok. However I have noticed KVM allows spare capacity to be used (if available) on the host, and the kvm host is suffering i.e. 200% for doing nothing.
As a comparison i have uploaded a snap shot of my production systems running suricata 5. As you see the utilisation on the suricata server is higher and there are more instances, but the kvm server is not showing much (in the screen shot). Though to be fare the CPU jumps all over the place between about 2% & 145% (typically under 90%) changing all the time as the load changes on the suricata server.
AW Updated by Andrew Welham over 5 years ago
I tried this command to start Suricata ( I think this is IDS mode)
/usr/bin/suricata -c /etc/suricata/suricata.yaml -i enp1s0
I've also tried to get some more detailed logs , but enabling debugging via the yaml config file or env makes no difference . I may be doing something wrong though
PM Updated by Peter Manev over 5 years ago
If you try
/usr/bin/suricata -c /etc/suricata/suricata.yaml -i enp1s0
Does it behave the same ? (sorry I did not understand)
AW Updated by Andrew Welham over 5 years ago
Yes It behaved the same..
I also tried downloading the source and compiling and the same behaviour happened
JY Updated by Jungho Yoon over 5 years ago
Some settings are different, but it seems to be a similar situation to my case.
PM Updated by Peter Manev over 5 years ago
@Jungho Yoon - in your case it seems you have traffic , here it is without traffic - am i correct ?
PM Updated by Peter Manev over 5 years ago
@Andrew Welham - how does the
suricata --build-info
Look like?
AW Updated by Andrew Welham over 5 years ago
Apologies I may have caused a little confusion here. The bug was initially detected on live product systems (in a keepalived cluster) and data flowing through them as in my initial post.
However as this bug was reproducible on a basic system (fresh install on a test system) with no traffic I used these details as the amount of data is does not look to be the cause.
so potentially the same issue as Jungho
Peter the requested build info is ( From a standard PPA)
/usr/bin/suricata  --build-info
This is Suricata version 6.0.0 RELEASE
Features: NFQ PCAP_SET_BUFF AF_PACKET HAVE_PACKET_FANOUT LIBCAP_NG LIBNET1.1 HAVE_HTP_URI_NORMALIZE_HOOK PCRE_JIT HAVE_NSS HAVE_LUA HAVE_LUAJIT HAVE_LIBJANSSON TLS TLS_C11 MAGIC RUST
SIMD support: none
Atomic intrinsics: 1 2 4 8 byte(s)
64-bits, Little-endian architecture
GCC version 9.3.0, C version 201112
compiled with _FORTIFY_SOURCE=2
L1 cache line size (CLS)=64
thread local storage method: _Thread_local
compiled with LibHTP v0.5.35, linked against LibHTP v0.5.35

Suricata Configuration:
  AF_PACKET support:                       yes
  eBPF support:                            no
  XDP support:                             no
  PF_RING support:                         no
  NFQueue support:                         yes
  NFLOG support:                           no
  IPFW support:                            no
  Netmap support:                          no
  DAG enabled:                             no
  Napatech enabled:                        no
  WinDivert enabled:                       no

  Unix socket enabled:                     yes
  Detection enabled:                       yes

  Libmagic support:                        yes
  libnss support:                          yes
  libnspr support:                         yes
  libjansson support:                      yes
  hiredis support:                         yes
  hiredis async with libevent:             yes
  Prelude support:                         no
  PCRE jit:                                yes
  LUA support:                             yes, through luajit
  libluajit:                               yes
  GeoIP2 support:                          yes
  Non-bundled htp:                         yes
  Old barnyard2 support:
  Hyperscan support:                       yes
  Libnet support:                          yes
  liblz4 support:                          yes

  Rust support:                            yes
  Rust strict mode:                        no
  Rust compiler path:                      /usr/bin/rustc
  Rust compiler version:                   rustc 1.43.0
  Cargo path:                              /usr/bin/cargo
  Cargo version:                           cargo 1.43.0
  Cargo vendor:                            yes

  Python support:                          yes
  Python path:                             /usr/bin/python3
  Python distutils                         yes
  Python yaml                              yes
  Install suricatactl:                     yes
  Install suricatasc:                      yes
  Install suricata-update:                 yes

  Profiling enabled:                       no
  Profiling locks enabled:                 no

  Plugin support (experimental):           yes

Development settings:
  Coccinelle / spatch:                     no
  Unit tests enabled:                      no
  Debug output enabled:                    no
  Debug validation enabled:                no

Generic build parameters:
  Installation prefix:                     /usr
  Configuration directory:                 /etc/suricata/
  Log directory:                           /var/log/suricata/

  --prefix                                 /usr
  --sysconfdir                             /etc
  --localstatedir                          /var
  --datarootdir                            /usr/share

  Host:                                    x86_64-pc-linux-gnu
  Compiler:                                gcc (exec name) / g++ (real)
  GCC Protect enabled:                     yes
  GCC march native enabled:                no
  GCC Profile enabled:                     no
  Position Independent Executable enabled: yes
  CFLAGS                                   -g -O2 -fdebug-prefix-map=/build/suricata-ngEYgo/suricata-6.0.0=. -fstack-protector-strong -Wformat -Werror=format-security -std=c11 -I${srcdir}/../rust/gen -I${srcdir}/../rust/dist
  PCAP_CFLAGS                               -I/usr/include
  SECCFLAGS                                -fstack-protector -D_FORTIFY_SOURCE=2 -Wformat -Wformat-security
JY Updated by Jungho Yoon over 5 years ago
Different settings mean that the OS or suricata.yaml are not exactly the same. My case written on the forum was only inline (IPS Mode). In the inline (IPS Mode) configuration, both with no traffic and with traffic showed the same occupancy as CPU polling in Host (KVM) (using NIC/suricata CPU-affinity). Also, CPU usage did not increase as much as KVM, but CPU usage seemed to increase in Hyper-V and ESXi after upgrading to 6.0.0.
AW Updated by Andrew Welham over 5 years ago
I don’t know if this helps, Given Junghoran the perf command I tried the following
On a freshly built VM hosted in KVM, running ubuntu 20.04 fully patched
I installed suricata 5 from the PPA (archive), and did not configure or add rules.
I ran the following
/usr/bin/suricata -c /etc/suricata/suricata.yaml -q 0 -D
NO TRAFFIC WOULD PASS
Let it settle for 30 seconds (if required) and ran
perf stat -e 'sched:*' -p PID sleep 10
The results were
Performance counter stats for process id '46427':
0      sched:sched_kthread_stop
                 0      sched:sched_kthread_stop_ret
               735      sched:sched_waking
               723      sched:sched_wakeup
                 0      sched:sched_wakeup_new
             1,096      sched:sched_switch
                 0      sched:sched_migrate_task
                 0      sched:sched_process_free
                 0      sched:sched_process_exit
                 0      sched:sched_wait_task
                 0      sched:sched_process_wait
                 0      sched:sched_process_fork
                 0      sched:sched_process_exec
                 0      sched:sched_stat_wait
                 0      sched:sched_stat_sleep
                 0      sched:sched_stat_iowait
                 0      sched:sched_stat_blocked
        46,246,224      sched:sched_stat_runtime
                 0      sched:sched_pi_setprio
                 0      sched:sched_process_hang
                 0      sched:sched_move_numa
                 0      sched:sched_stick_numa
                 0      sched:sched_swap_numa
                 0      sched:sched_wake_idle_without_ipi
10.002187522 seconds time elapsedI then uninstalled suricata 5
I installed suricata 6 from PPA, and did not configure or add rules.
I ran the following
/usr/bin/suricata -c /etc/suricata/suricata.yaml -q 0 -D
NO TRAFFIC WOULD PASS
Let it settle for 30 seconds (if required) and ran
perf stat -e 'sched:*' -p PID sleep 10
Performance counter stats for process id '46739':
0      sched:sched_kthread_stop
                 0      sched:sched_kthread_stop_ret
                19      sched:sched_waking
                11      sched:sched_wakeup
                 0      sched:sched_wakeup_new
           128,412      sched:sched_switch
                 0      sched:sched_migrate_task
                 0      sched:sched_process_free
                 0      sched:sched_process_exit
                 0      sched:sched_wait_task
                 0      sched:sched_process_wait
                 0      sched:sched_process_fork
                 0      sched:sched_process_exec
                 0      sched:sched_stat_wait
                 0      sched:sched_stat_sleep
                 0      sched:sched_stat_iowait
                 0      sched:sched_stat_blocked
       948,229,557      sched:sched_stat_runtime
                 0      sched:sched_pi_setprio
                 0      sched:sched_process_hang
                 0      sched:sched_move_numa
                 0      sched:sched_stick_numa
                 0      sched:sched_swap_numa
                 0      sched:sched_wake_idle_without_ipi
10.001963231 seconds time elapsed
There are some considerable differences, hope this helps.AW Updated by Andrew Welham over 5 years ago
Any sign of this issue being investigated ?
PM Updated by Peter Manev over 5 years ago
Can you please share a bit more info how to reproduce this on the KVM host? Any details/specifics would help as it seems the issue is explicit(most severe) with KVM and 6.0 combination.
AW Updated by Andrew Welham over 5 years ago
- File kvm-VM-config.xml kvm-VM-config.xml added
- File VirtualBox.xml VirtualBox.xml added
Peter,
I've done a few more tests on KVM and also Virtual box (on a windows host).
The virtual box did not seem to suffer so much as is demonstrated by the results below, but there was still a difference,
when tested with perf stat -e 'sched:*' -p PID sleep 10. I have also included the config files for both VMs. They are standard VMs with more memory and CPU and a bridged NIC (single in this test case) 10 in the case of my production machine. The results are however very similar so it does not look to be down to the number of NICs.
Let me know if you want any further information
kvm suricata 6
Performance counter stats for process id '20841':
0      sched:sched_kthread_stop
                 0      sched:sched_kthread_stop_ret
                21      sched:sched_waking
                 9      sched:sched_wakeup
                 0      sched:sched_wakeup_new
           129,069      sched:sched_switch
                 0      sched:sched_migrate_task
                 0      sched:sched_process_free
                 0      sched:sched_process_exit
                 0      sched:sched_wait_task
                 0      sched:sched_process_wait
                 0      sched:sched_process_fork
                 0      sched:sched_process_exec
                 0      sched:sched_stat_wait
                 0      sched:sched_stat_sleep
                 0      sched:sched_stat_iowait
                 0      sched:sched_stat_blocked
       849,350,259      sched:sched_stat_runtime
                 0      sched:sched_pi_setprio
                 0      sched:sched_process_hang
                 0      sched:sched_move_numa
                 0      sched:sched_stick_numa
                 0      sched:sched_swap_numa
                 1      sched:sched_wake_idle_without_ipi
10.005035852 seconds time elapsedkvm suricata 5
- perf stat -e 'sched:*' -p 1447 sleep 10
Performance counter stats for process id '1447':
0      sched:sched_kthread_stop
                 0      sched:sched_kthread_stop_ret
                28      sched:sched_waking
                27      sched:sched_wakeup
                 0      sched:sched_wakeup_new
            13,474      sched:sched_switch
                 7      sched:sched_migrate_task
                 0      sched:sched_process_free
                 0      sched:sched_process_exit
                 0      sched:sched_wait_task
                 0      sched:sched_process_wait
                 0      sched:sched_process_fork
                 0      sched:sched_process_exec
                 0      sched:sched_stat_wait
                 0      sched:sched_stat_sleep
                 0      sched:sched_stat_iowait
                 0      sched:sched_stat_blocked
       258,451,732      sched:sched_stat_runtime
                 0      sched:sched_pi_setprio
                 0      sched:sched_process_hang
                 0      sched:sched_move_numa
                 0      sched:sched_stick_numa
                 0      sched:sched_swap_numa
                 0      sched:sched_wake_idle_without_ipi
10.003212991 seconds time elapsed
virtualbox suricata 6
Performance counter stats for process id '1447':0 sched:sched_kthread_stop
0 sched:sched_kthread_stop_ret
34 sched:sched_waking
38 sched:sched_wakeup
0 sched:sched_wakeup_new
8,878 sched:sched_switch
20 sched:sched_migrate_task
0 sched:sched_process_free
0 sched:sched_process_exit
0 sched:sched_wait_task
0 sched:sched_process_wait
0 sched:sched_process_fork
0 sched:sched_process_exec
0 sched:sched_stat_wait
0 sched:sched_stat_sleep
0 sched:sched_stat_iowait
0 sched:sched_stat_blocked
202,047,094 sched:sched_stat_runtime
0 sched:sched_pi_setprio
0 sched:sched_process_hang
0 sched:sched_move_numa
0 sched:sched_stick_numa
0 sched:sched_swap_numa
0 sched:sched_wake_idle_without_ipi10.006997425 seconds time elapsedVirtual box Suricata 5
perf stat -e 'sched:*' -p 22517 sleep 10
Performance counter stats for process id '22517':0 sched:sched_kthread_stop
0 sched:sched_kthread_stop_ret
9,654 sched:sched_waking
9,644 sched:sched_wakeup
0 sched:sched_wakeup_new
1,097 sched:sched_switch
0 sched:sched_migrate_task
0 sched:sched_process_free
0 sched:sched_process_exit
0 sched:sched_wait_task
0 sched:sched_process_wait
0 sched:sched_process_fork
0 sched:sched_process_exec
0 sched:sched_stat_wait
0 sched:sched_stat_sleep
0 sched:sched_stat_iowait
0 sched:sched_stat_blocked
150,835,414 sched:sched_stat_runtime
0 sched:sched_pi_setprio
0 sched:sched_process_hang
0 sched:sched_move_numa
0 sched:sched_stick_numa
0 sched:sched_swap_numa
1 sched:sched_wake_idle_without_ipi10.002084152 seconds time elapsedAW Updated by Andrew Welham over 5 years ago
i was reading https://forum.suricata.io/t/cpu-usage-of-version-6-0-0/706/20
and also other articles in the internet about usleep() and some instances of high CPU.
As a test i build from source suricata and changed the values in the usleep() calls inside flow-manager.c and the CPU dropped dramatically.
I tried various figures ranging from doubling to adding an extra 0 (nothing scientific).
I realise this only slows up suricata , but the CPU did drop in some cases to 25% from 200% so nothing perfect but an indicator of the direction.
I have not tested but based on the article Victor Julien may be on to something.
VJ Updated by Victor Julien over 5 years ago
- Status changed from New to Assigned
- Assignee set to Victor Julien
- Target version set to 7.0.0-beta1
- Label Needs backport to 6.0 added
I can reproduce this. It looks like changing the usleep value to 200 already gives a big improvement, but setting it much higher to something like 5000 gives better results. Need to look at what the impact is of changing this.
VJ Updated by Victor Julien over 5 years ago
- Subject changed from Ubuntu 20.04 PPA upgraded to Suricata 6 now @ 200% CPU with no activity to flow manager: 200% CPU in KVM host with no activity with Suricata 6
VJ Updated by Victor Julien over 5 years ago
It is not related to the PPA. Happens with compiles from source as well.
MT Updated by Michael Tremer over 5 years ago
Hello boys,
I would like to let you know that we have been experiencing the same issue with IPFire installations, too.
We have upgraded from Suricata 5 to 6 and did not change a line in the configuration file. On regular hardware, load has increases quite a bit, and it is through the roof on virtual machines.
Our configuration file is here (https://git.ipfire.org/?p=ipfire-2.x.git;a=blob;f=config/suricata/suricata.yaml;h=4e9e399675551c8a5bfd81568da622b2f3767576;hb=HEAD) and it should be fairly slow to the stock configuration.
We have not looked too deep into this yet, but we are tracking it all here (https://bugzilla.ipfire.org/show_bug.cgi?id=12548).
JL Updated by Jeff Lucovsky over 5 years ago
- Copied to Bug #4314: flow manager: 200% CPU in KVM host with no activity with Suricata 6 added
VJ Updated by Victor Julien over 5 years ago
- Status changed from Assigned to Closed
MT Updated by Michael Tremer over 5 years ago
Thank you for the fix. We have compiled this and tested it, but I am afraid to have to report that it does not fix this, but it makes is very slightly better.
This graphs shows CPU usage on an idle machine that is running suricata 5: https://bugzilla.ipfire.org/attachment.cgi?id=858
This shows CPU usage on the same machine with suricata 6.0.1 and the patch: https://bugzilla.ipfire.org/attachment.cgi?id=859
Therefore, I would like to request to reopen this ticket and search for a solution that brings us back down to levels of suricata 5. Apart from slowing down other applications because of the CPU being busy running in a loop, this is going to waste a lot of energy across our whole installation base.
Of course we are here, happy to help with verifying any proposed solutions. Thank you for looking into this.
VJ Updated by Victor Julien over 5 years ago
Thanks for the follow up @mtremer I've created #4379 to track this.
MT Updated by Michael Tremer over 5 years ago
Thank you!
SJ Updated by Srini J over 4 years ago
Since this issue is related to KVM and usleep(). Please check if tweaking KVM module parameter halt_poll_ns helps.
Reference:
https://forum.suricata.io/t/cpu-usage-of-version-6-0-0/706/22?u=srini38
MT Updated by Michael Tremer over 4 years ago
Srini J wrote in #note-32:
Since this issue is related to KVM and usleep()
I would like to raise that it isn't. It is very visible on KVM, but I can also confirm that it shows up on bare metal installations on Intel Celeron processors and Intel Xeons.
Please have a look here for a couple of people who have reported this problem: https://lists.ipfire.org/pipermail/development/2020-December/008868.html