Optimization #6747
opendpdk: synchronized CPU stalls on Suricata workers
Description
This is a report on trying to figure out why independent Suricata workers have the same access patterns to a Mellanox NIC. The debug tool that I am using is primarily Intel Vtune.
I am using 8 cores for packet processing, each core has an independent processing queue. All application cores are on the same NUMA node. Importantly, this only happens on Mellanox/NVIDIA NIC (currently MT2892 Family - mlx5) and NOT on X710. Suricata is compiled with DPDK (2 versions tested, replicated on both - master 1dcf69b211 (https://github.com/OISF/suricata/) and version with interrupt support (commit c822f66b - https://github.com/lukashino/suricata/commits/feat-power-saving-v4/)).
For packet generation I use the Trex packet generator on an independent server in ASTF mode with the command "start -f astf/http_simple.py -m 6000". The traffic exchanged between the two trex interfaces is mirrored on a switch to Suricata interface. That yields roughly 4.6 Gbps of traffic. The traffic is a simple http GET request yet the flows are alternating each iteration with an increment in an IP address. RSS then distributes the traffic evenly across all cores. The problem occurs both on 500 Mbps and on 20 Gbps transmit speed.
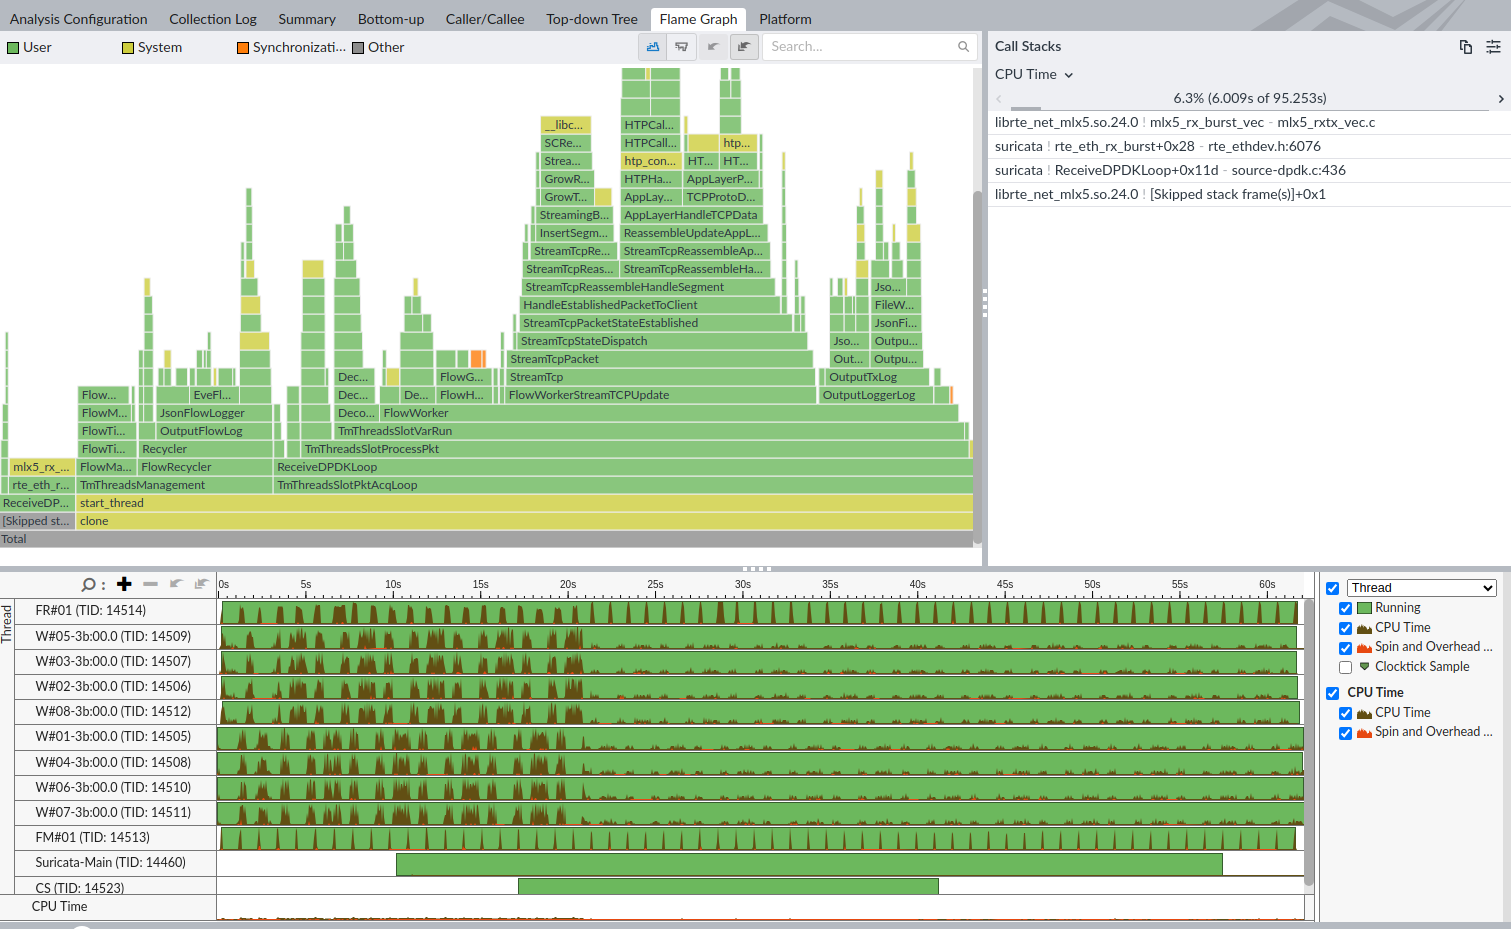
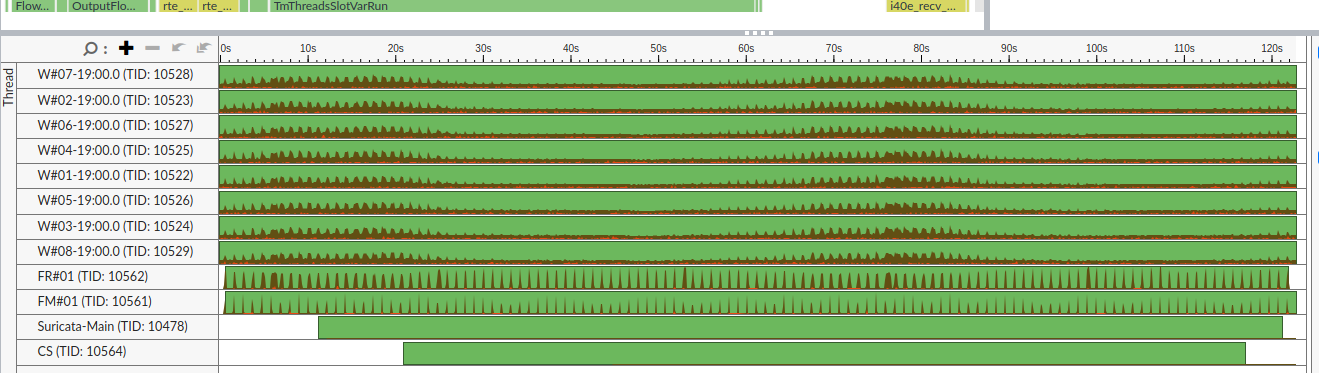
This is a flame graph from one of the runs. I wonder why CPUs have almost synchronous no CPU/some CPU activity in the graph below. The worker cores are denoted with "W#0..." and are in 2 groups that are alternating. CPU stalls can be especially seen in regions of high CPU activity but it is present also with low CPU activity. Having high/low CPU activity is not relevant here as I am only interested in the pattern of CPU stalls. It suggest for some shared resource. But even with a shared resource it would not be paused synchronously but randomly blocked.
I am debugging the application with interrupts enabled however the same pattern occurs when poll mode is enabled. When polling mode is active I filtered out mlx5 module activity from the Vtune result and was still able to see CPU pauses ranging from 0.5 to 1 second across all cores.
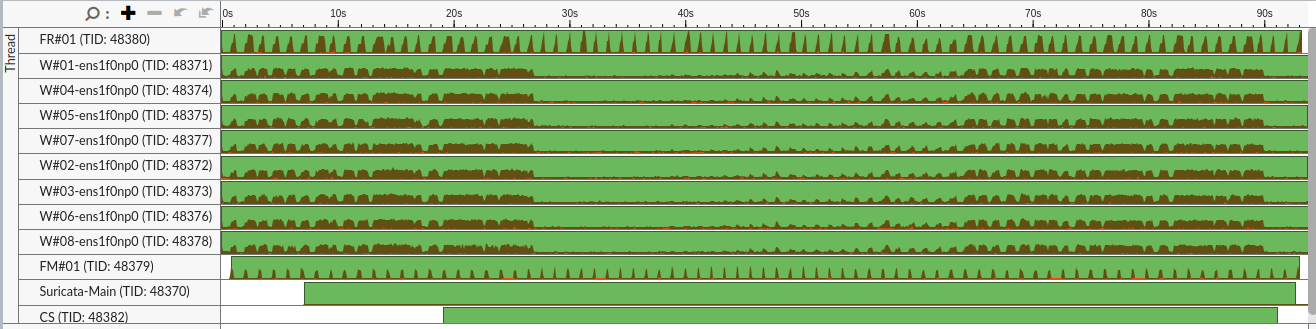
DPDK 8 cores, MLX5 NIC
I tried to profile Suricata in different scenarios and this pattern of complete CPU stalls doesn't happen elsewhere.
e.g.
AF_PACKET 8 cores, MLX5 NIC, the CPU activity is similar across cores but the cores never pause:
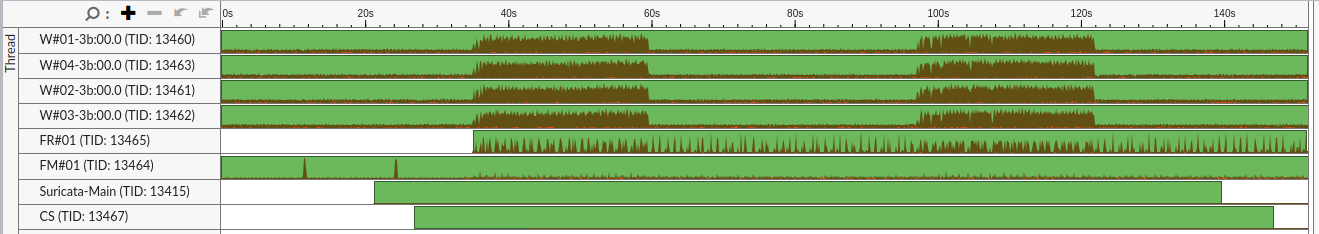
DPDK 4 cores, MLX5 NIC,
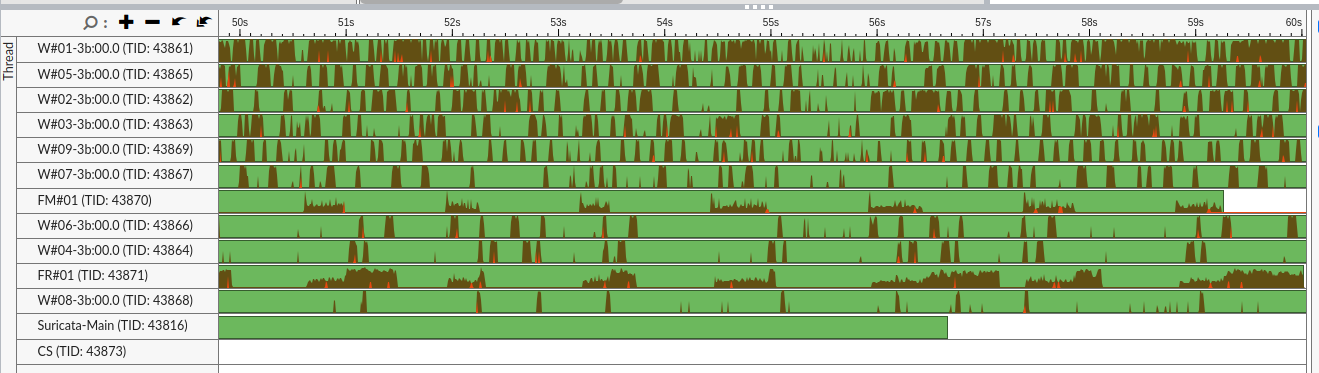
DPDK 9 cores, MLX5 NIC
DPDK 8 cores, X710 NIC, no CPU stalls on worker cores
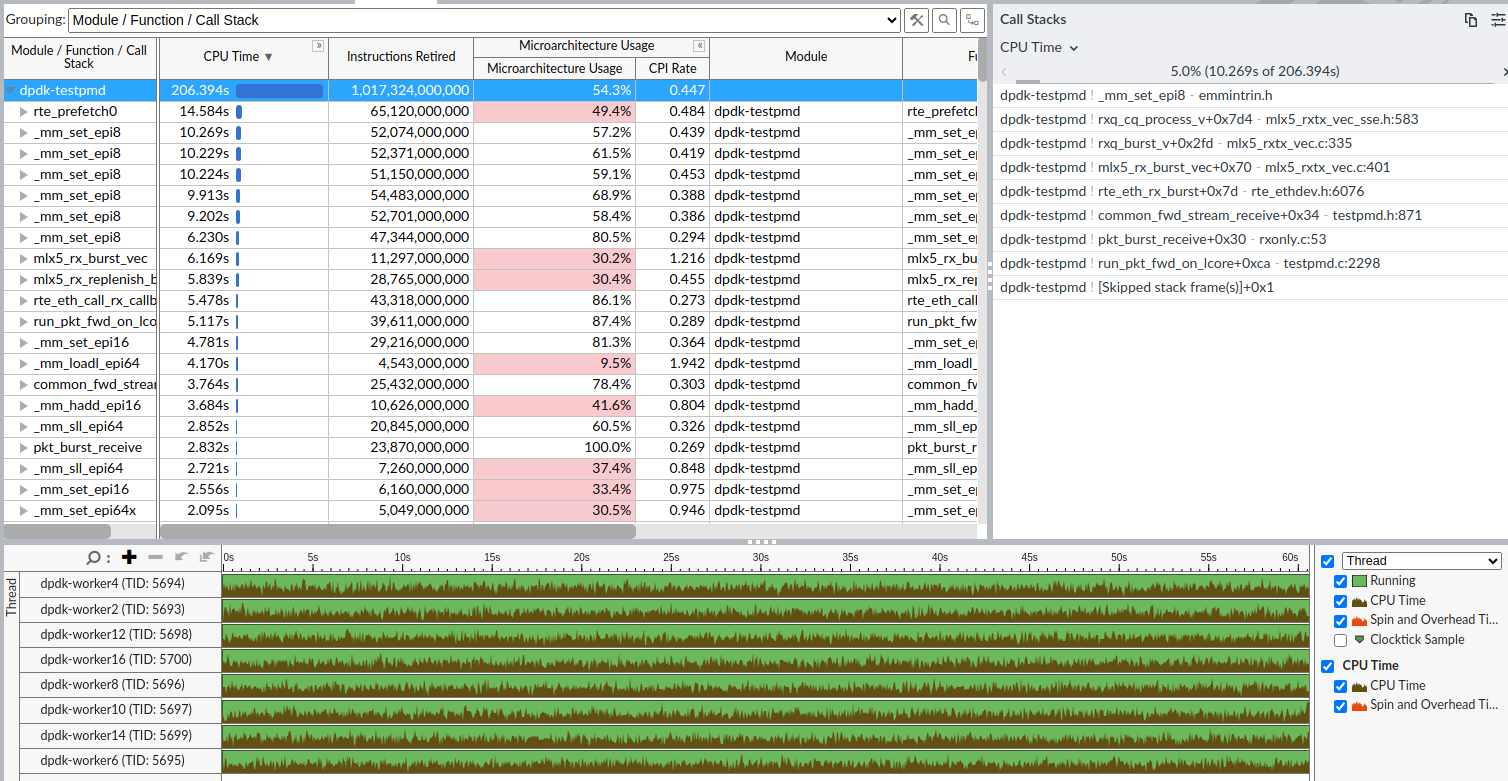
Testpmd, MLX5, 8 cores, I tried to filter out majority of RX NIC functions and it still seems that CPUs are being continuously active. (It was running in rxonly fwd mode, with 8 queues and 8 cores) Though I am a bit skeptical about the CPU activity as testpmd only receives/discards the traffic.
It seems like the issue is connected with MLX5 NIC and DPDK as it works well with AF_PACKET, and also with lower/higher number of threads.
Any input is greatly welcome.
Files