Bug #4502
closedTCP reassembly memuse approaching memcap value results in TCP detection being stopped
Description
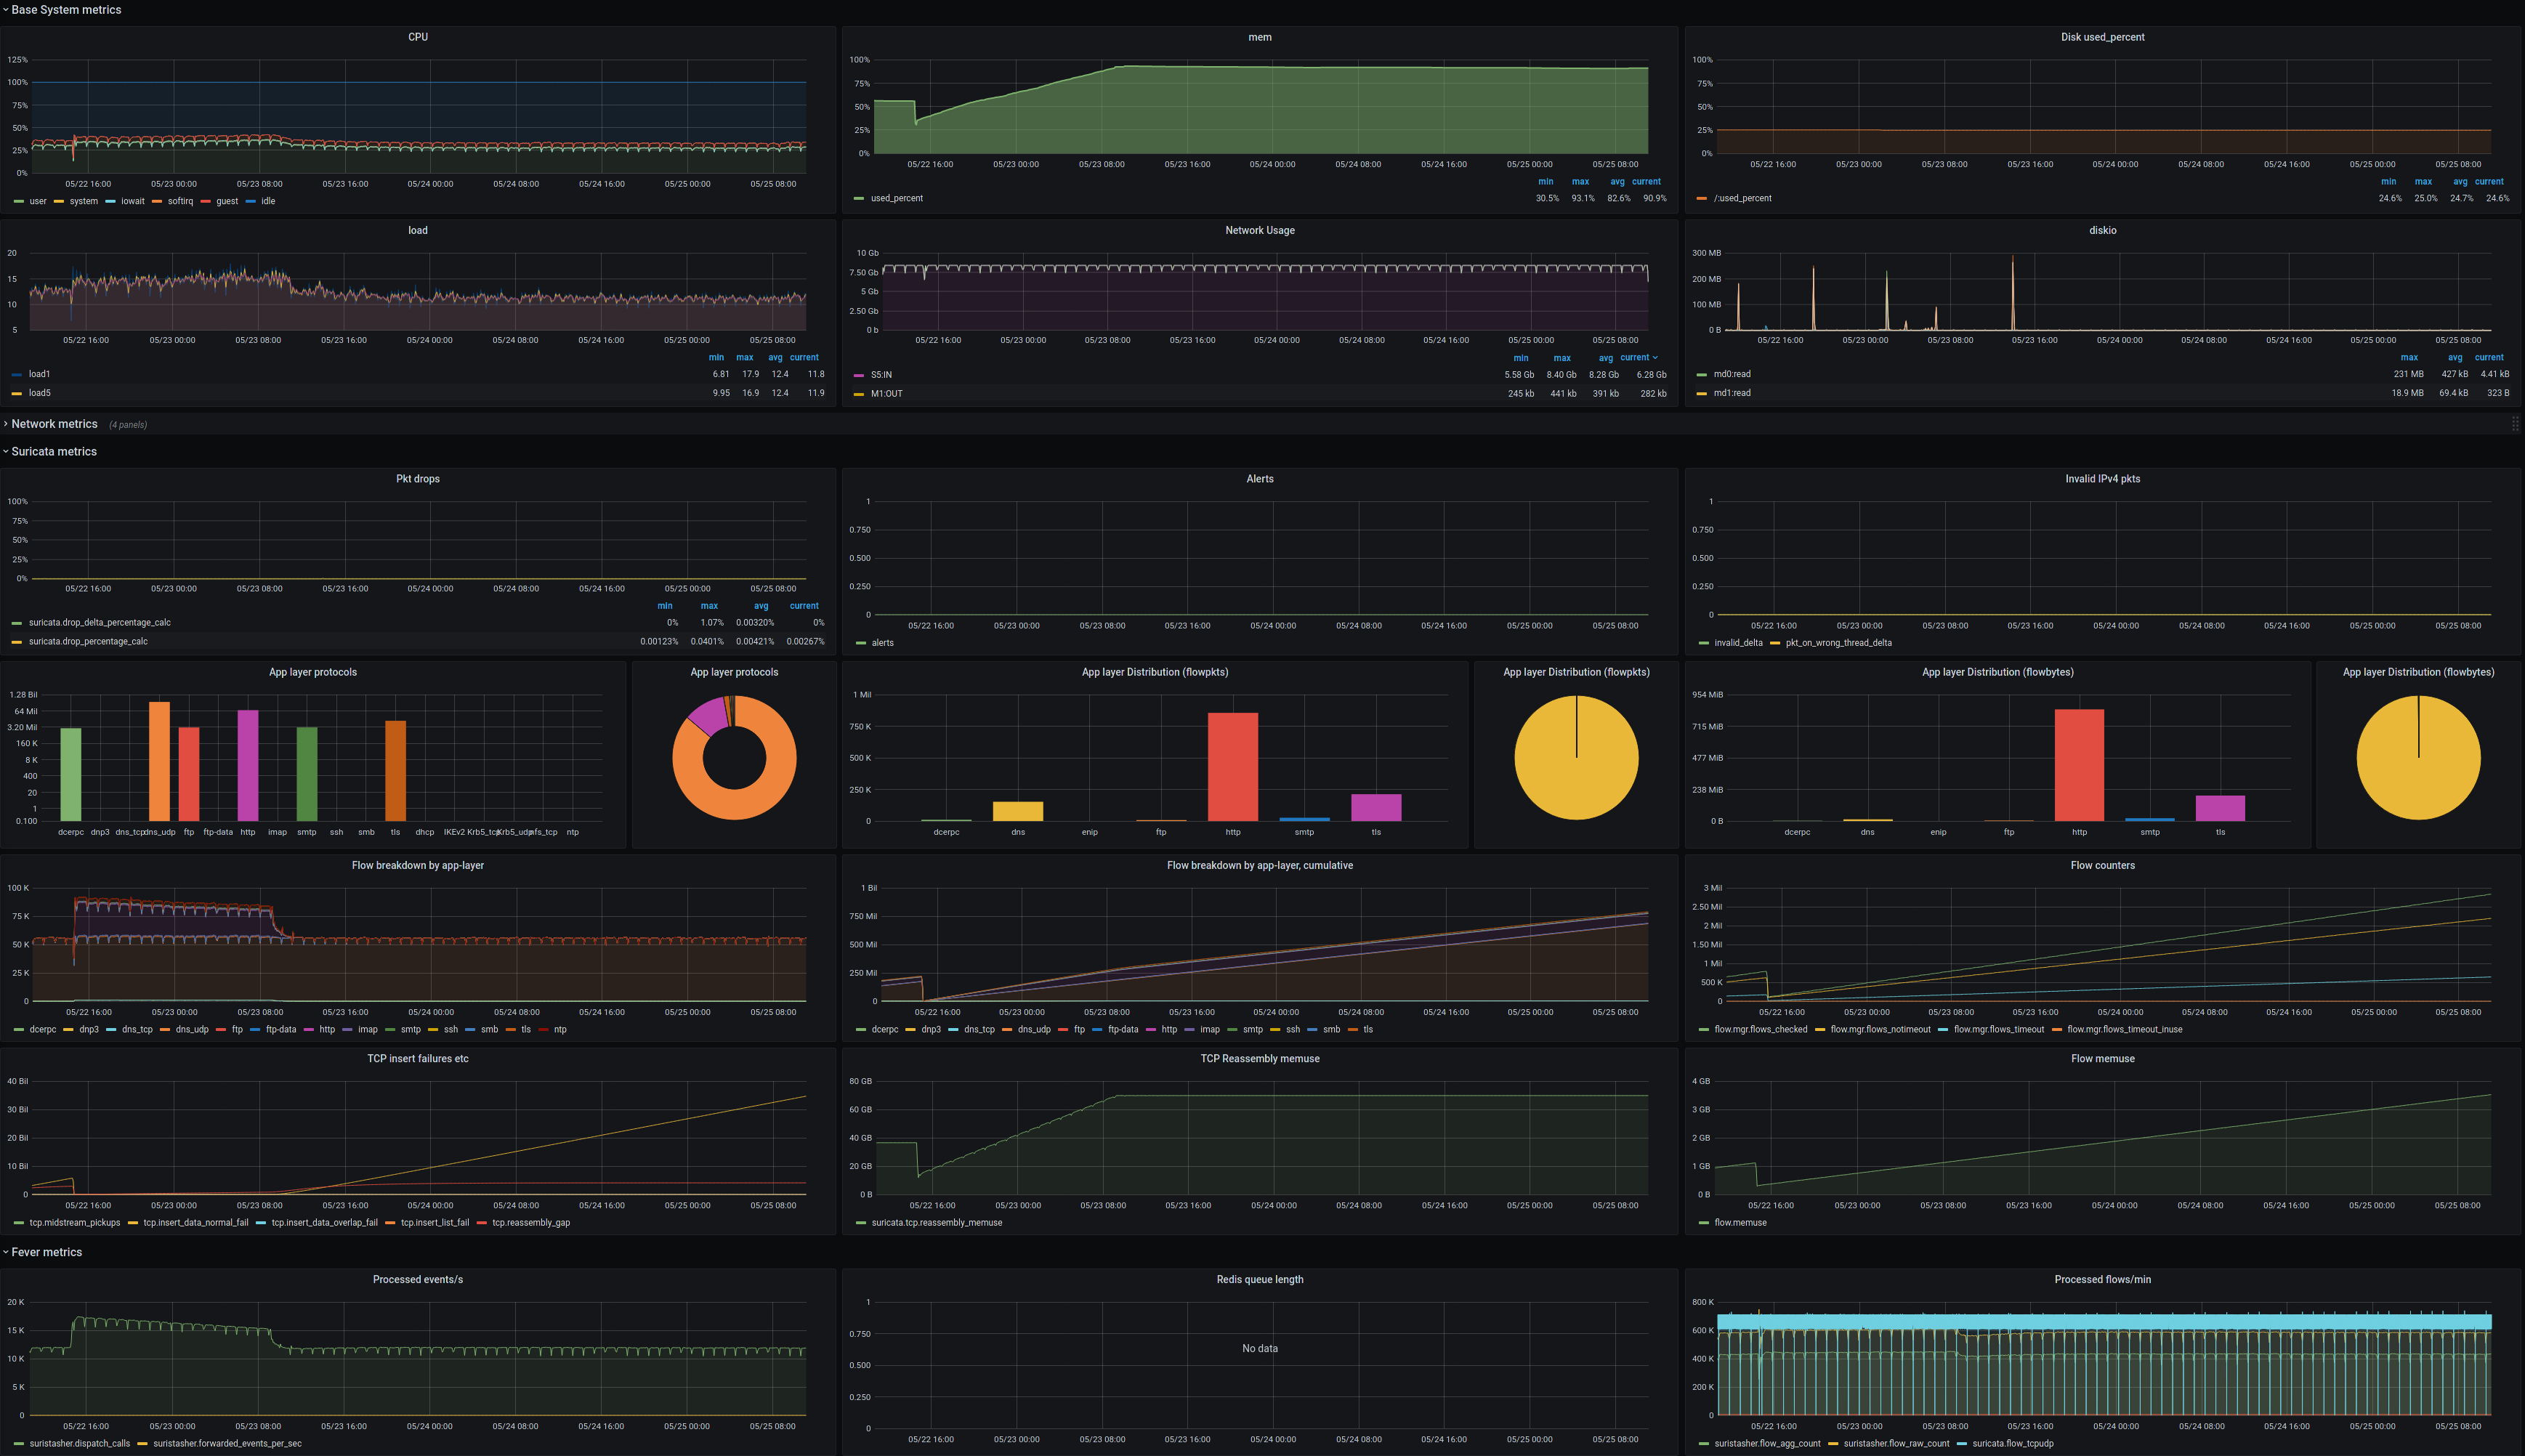
We discovered on the majority of 6.0 deployments have an increase in overall memory usage but especially for tcp reassembly memusage we saw an increase that results with the memuse hitting the memcap (but not .memcap entry in stats.log) and at that point nearly the whole tcp app-layer detection stopped.
We see on all of those deployments some amount of tcp.reassambly_gaps and after the breakpoint where tcp reassembly memuse hits the memcap border those gaps increase much more and now tcp.insert_data_normal_fail starts to occur as well. As you can see in the Grafana output there are some correlations:
- tcp reassembly memuse hitting the limit after less then 24hours with a 8Gbit/s traffic ingest (done via t-rex)
- tcp insert fail rise as soon as the limit is hit
- tcp gaps make a jump as well
- tcp app layer totally gone, only udp (dns) still inspected
- stable values of traffic, load, no drops, flows/min
The most interesting thing is that we can't reproduce it with 5.0.3 while everything else is the same (we only changed the config to not use the new app layer parsers that are only in 6.0).
(In general the overall memory usage with 5.0.3 is much smaller compared to 6.0.2)
In 5.0.3 the tcp memuse as well as flow memuse settle at one plateau which makes much more sense compared to the stable t-rex traffic ingest.
Some system Details:
Debian Buster with 5.10 Backports kernel.
Capture on X710 10GE SFP+ NICS with AF_PACKETv3 although there was no diff with using cluster_qm + RSS setting or just cluster_flow with 1 Queue.
Current workaround is a daily restart of Suricata for 6.0.2 and might be necessary to rollback to 5.0.3.
Any hints where we should look on the code side will help, nevertheless we will also check the git log if we can spot something for that regression.
Files
AH Updated by Andreas Herz about 5 years ago
- Effort set to medium
AH Updated by Andreas Herz about 5 years ago
We also saw, on live deployments, that the flow.timeout_inuse counter is between 30-70% of the overall flows. So might seem to be another correlation that would hint that some flows don't timeout as before
PM Updated by Peter Manev about 5 years ago
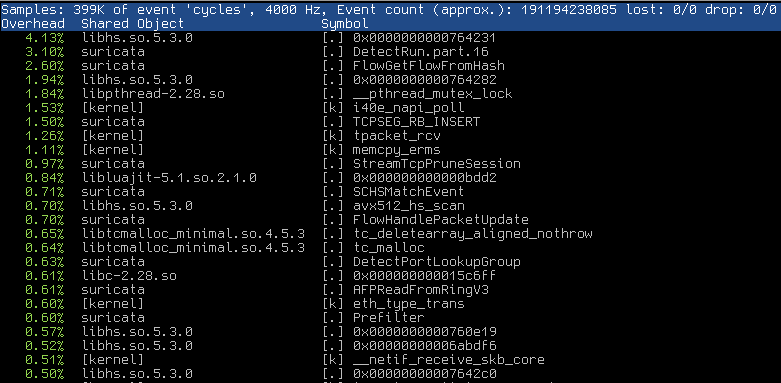
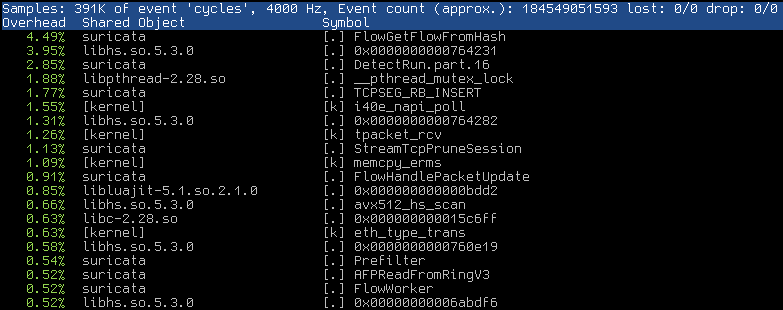
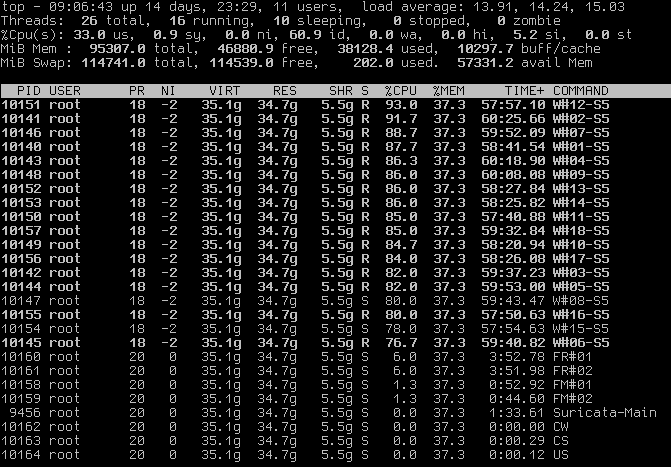
Is it possible to post: build-info and pef top, top -H -p suripid when that starts to happen?
Also there is no midstream pickups in the config enabled right?
AH Updated by Andreas Herz about 5 years ago
- File buildinfo_50.txt buildinfo_50.txt added
- File buildinfo_60.txt buildinfo_60.txt added
- File flowmemuse.png flowmemuse.png added
- File perftop50.png perftop50.png added
- File perftop60.png perftop60.png added
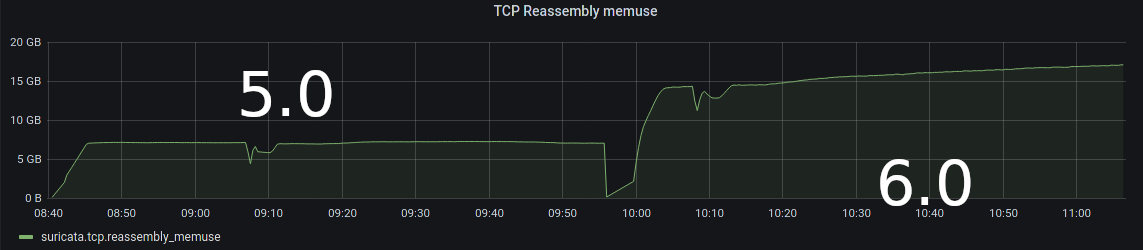
- File tcpmemuse.png tcpmemuse.png added
- File top50.png top50.png added
- File top60.png top60.png added
AH Updated by Andreas Herz about 5 years ago
midstream pickup is not enabled.
Both runs you see are the same traffic (via trex), same config it's just the different versions of Suricata.
5.0 stable memuse as expected with the stable traffic, with 6.0 it is increasing and after some hours will hit the memcap.
PM Updated by Peter Manev about 5 years ago
I am not sure if ti is related, but noticed the following for 5.x from the info provided
compiled with LibHTP v0.5.33, linked against LibHTP v0.5.37
Also rust is not the same version. 1.34 for 5.x and 1.42 for 6.0.
Wondering if it has any effect - just something worth of "equalizing" to remove it as potential cause.
AH Updated by Andreas Herz about 5 years ago
good catch, we did a rebuild with the same versions that are used for 6.0 but no change, 5.0 still looking good and 6.0 bad. So we can rule that out as well.
We could at least narrow it down to this commit set:
last known good commit https://github.com/OISF/suricata/commit/be57f6d3cc74f3bb1315439218c24a928cae7c48
first known bad https://github.com/OISF/suricata/commit/999af4f62a234d78f682c2b842f434410a61f56f (is just documentation)
So in between are several Flow related commits from that I see in https://github.com/OISF/suricata/pull/5284 as well. Which would make sense since the relevant sections have been touched/changed. But the change is rather complex so might take some time to find out what causes the big memory increase/"leak".
So either the whole rework or a specific commit seems to be the reason for that.
AH Updated by Andreas Herz about 5 years ago
A deeper dive revealed:
last known good commit https://github.com/OISF/suricata/commit/48605f48674b1478a7dfcb03d67fa2d92eff4f51#diff-ae20d432e75e77294238b0a3633016e6efaa39c1b759d2a1d0b18e135bed7eac
first bad one https://github.com/OISF/suricata/commit/b3599507f4eb891841417575587d690ea13fe6c0#diff-ae20d432e75e77294238b0a3633016e6efaa39c1b759d2a1d0b18e135bed7eac
in between the commit https://github.com/OISF/suricata/commit/2fd7c87f2271b14ba8c1ed4246c04fbe0457b1cf#diff-ae20d432e75e77294238b0a3633016e6efaa39c1b759d2a1d0b18e135bed7eac introcuded another regression that lead to a very low tcp reassembly memuse but high flow use and much more events and flows on a T-rex test setup which also resulted in much higher drops, but nearly 0 tcp reassembly gaps.
OJ Updated by Odin Jenseg about 5 years ago
I think this issue is related to what I observed in https://redmine.openinfosecfoundation.org/issues/4200. We did observe issues around increasing flows in the eBPF map that was never deleted, and a huge difference between the number of "closed" bypass flows in 5 and 6. Its been a while since I did any testing on 6, but using Suricata 5 did resolve our issue.
AH Updated by Andreas Herz almost 5 years ago
- File massif.out massif.out added
- File massif2.out massif2.out added
I added two valgrind runs with massif enabled, as you can see one has stable memory usage, the other has a steady increase while it's the same traffic
AH Updated by Andreas Herz almost 5 years ago
Comparing the two outputs between the good and the bad one you can see that the good one has 92% in the SCMallocFunc tree and just 4% for the SCReallocFunc while that increases in the bad one to 42%. This could explain the increase in memory usage if it's not released or at least not released fast enough.
So looking into flow-worker and tm-threads changes will be the next step.
AH Updated by Andreas Herz almost 5 years ago
I did a check on all deployments and while I can see the issue everywhere I can also confirm that it's not solely related to `tcp.reassembly_gap` since I have several deployments with the issue that don't have any gaps.
So IMHO most of the correlation are just a sideeffect.
AH Updated by Andreas Herz almost 5 years ago
- Related to Bug #4650: Stream TCP raw reassembly is leaking added
AH Updated by Andreas Herz almost 5 years ago
- Related to Optimization #4652: GAP handling improvements seem expensive added
AH Updated by Andreas Herz almost 5 years ago
- Related to Optimization #4653: Flow cleaning with chunked approach is memory hungry added
AH Updated by Andreas Herz almost 5 years ago
- Related to Bug #4654: tcp: insert_data_normal_fail can hit without triggering memcap added
AH Updated by Andreas Herz almost 5 years ago
(Possible) Related forum posts:
https://forum.suricata.io/t/kernel-drops-and-optimization-recommendations/1044/5
https://forum.suricata.io/t/accumulation-of-flow-timeout-inuse/880/10 (with nearly the same graphana output)
VJ Updated by Victor Julien over 4 years ago
- Status changed from New to In Progress
- Assignee set to Victor Julien
- Target version changed from TBD to 7.0.0-beta1
VJ Updated by Victor Julien over 3 years ago
- Status changed from In Progress to Closed
Closing this as a lot as been done to improve this. If this is still or again an issue, it will need new analysis, tools output, etc. So a new ticket would be best then.