Support #3119
closedhelp optimizing suricata in af-packet mode for 30gbps+ traffic
Description
Hello Everyone,
I am trying to setup suricata for a high speed network. I am using T-Rex to test traffic on suricata, but am not able to get the desired throughput and incurring heavy packet drops and tcp.reassembly-gaps.
My setup - Suricata version 5.0.0-dev (3a912446a 2019-07-22) using Mellanox ConnectX®-5 100GbE Single/Dual-Port Adapters.
Debian Version 9.9
Kernel Version 4.9.0-9-amd64
My questions are:
1. What should be the ideal ring-size? Should I increase ring-size on af-packet and keep Ring parameters on NIC to 1024 or small. It can go up to 8196 on the Mellanox cards.
Current ring size - ring-size: 500000
2. CPU affinity is set as per NUM Node.
NUMA node0 CPU: 0-19,40-59
NUMA node1 CPU: 20-39,60-79
cat /sys/class/net/ens2f0/device/numa_node
0
cat /sys/class/net/ens2f1/device/numa_node
0
CPU affinity on suricata:
set-cpu-affinity: yes
#
cpu-affinity:
- management-cpu-set:
cpu: [ 0,1,2,20 ] # include only these CPUs in affinity settings
mode: "exclusive"
prio:
default: "high"
- worker-cpu-set:
cpu: [ "3-19","40-59" ]
mode: "exclusive"
prio:
default: "high"
#
detect-thread-ratio: 1.0
3. Tried compiling with XDP filter, but not much changed, therefore changed cluster-type to cluster_flow. Currently running on 4.9.0-9-amd64, so had to recompile suricata on kernel 4.19, to get XDP working. But as nothing changed, revert back to 4.9.
My suricata.yaml file is attached.
Files
SN Updated by Srijan Nandi almost 7 years ago
Srijan Nandi wrote:
Hello Everyone,
I am trying to setup suricata for a high speed network. I am using T-Rex to test traffic on suricata, but am not able to get the desired throughput and incurring heavy packet drops and tcp.reassembly-gaps.
My setup - Suricata version 5.0.0-dev (3a912446a 2019-07-22) using Mellanox ConnectX®-5 100GbE Single/Dual-Port Adapters.
Debian Version 9.9
Kernel Version 4.9.0-9-amd64My questions are:
1. What should be the ideal ring-size? Should I increase ring-size on af-packet and keep Ring parameters on NIC to 1024 or small. It can go up to 8196 on the Mellanox cards.
Current ring size - ring-size: 500000
2. CPU affinity is set as per NUM Node.
NUMA node0 CPU: 0-19,40-59
NUMA node1 CPU: 20-39,60-79cat /sys/class/net/ens2f0/device/numa_node
0
cat /sys/class/net/ens2f1/device/numa_node
0CPU affinity on suricata:
set-cpu-affinity: yes #
cpu-affinity:
- management-cpu-set:
cpu: [ 0,1,2,20 ] # include only these CPUs in affinity settings
mode: "exclusive"
prio:
default: "high"
- worker-cpu-set:
cpu: [ "3-19","40-59" ]
mode: "exclusive"
prio:
default: "high" #
detect-thread-ratio: 1.03. Tried compiling with XDP filter, but not much changed, therefore changed cluster-type to cluster_flow. Currently running on 4.9.0-9-amd64, so had to recompile suricata on kernel 4.19, to get XDP working. But as nothing changed, revert back to 4.9.
My suricata.yaml file is attached.
Srijan Nandi wrote:
Hello Everyone,
I am trying to setup suricata for a high speed network. I am using T-Rex to test traffic on suricata, but am not able to get the desired throughput and incurring heavy packet drops and tcp.reassembly-gaps.
My setup - Suricata version 5.0.0-dev (3a912446a 2019-07-22) using Mellanox ConnectX®-5 100GbE Single/Dual-Port Adapters.
Debian Version 9.9
Kernel Version 4.9.0-9-amd64
RAM 512 Gb
Intel(R) Xeon(R) Gold 6138 CPU @ 2.00GHMy questions are:
1. What should be the ideal ring-size? Should I increase ring-size on af-packet and keep Ring parameters on NIC to 1024 or small. It can go up to 8196 on the Mellanox cards.
Current ring size - ring-size: 500000
2. CPU affinity is set as per NUM Node.
NUMA node0 CPU: 0-19,40-59
NUMA node1 CPU: 20-39,60-79cat /sys/class/net/ens2f0/device/numa_node
0
cat /sys/class/net/ens2f1/device/numa_node
0CPU affinity on suricata:
set-cpu-affinity: yes #
cpu-affinity:
- management-cpu-set:
cpu: [ 0,1,2,20 ] # include only these CPUs in affinity settings
mode: "exclusive"
prio:
default: "high"
- worker-cpu-set:
cpu: [ "3-19","40-59" ]
mode: "exclusive"
prio:
default: "high" #
detect-thread-ratio: 1.03. Tried compiling with XDP filter, but not much changed, therefore changed cluster-type to cluster_flow. Currently running on 4.9.0-9-amd64, so had to recompile suricata on kernel 4.19, to get XDP working. But as nothing changed, revert back to 4.9.
My suricata.yaml file is attached.
SN Updated by Srijan Nandi almost 7 years ago
tail -f stats.log | grep "kernel_packet\|kernel_drops\|tcp.reassmebly_gap\|tcp.pkt_on_wrong_thread"
capture.kernel_packets | Total | 16185038
capture.kernel_drops | Total | 26624
tcp.pkt_on_wrong_thread | Total | 9167155
capture.kernel_packets | Total | 48474717
capture.kernel_drops | Total | 1541685
tcp.pkt_on_wrong_thread | Total | 22964389
capture.kernel_packets | Total | 65281066
capture.kernel_drops | Total | 1762627
tcp.pkt_on_wrong_thread | Total | 31693630
SN Updated by Srijan Nandi almost 7 years ago
- File suricata.yaml suricata.yaml added
Upgraded kernel to 4.19 and compiled suricata with ebpf support. Now, the config looks as attached.
Still with 30 gbps of traffic there is packet drops and packets on wrong threads.
capture.kernel_drops | Total | 32415994
tcp.pkt_on_wrong_thread | Total | 651099570
capture.kernel_packets | Total | 1212084899
capture.kernel_drops | Total | 32415994
tcp.pkt_on_wrong_thread | Total | 651099570
capture.kernel_packets | Total | 1212084899
capture.kernel_drops | Total | 32415994
tcp.pkt_on_wrong_thread | Total | 651099570
capture.kernel_packets | Total | 1212084899
capture.kernel_drops | Total | 32415994
tcp.pkt_on_wrong_thread | Total | 651099570
capture.kernel_packets | Total | 1212084899
capture.kernel_drops | Total | 32415994
tcp.pkt_on_wrong_thread | Total | 651099570
NIC Settings:
ethtool -g ens2f0
Ring parameters for ens2f0:
Pre-set maximums:
RX: 8192
RX Mini: 0
RX Jumbo: 0
TX: 8192
Current hardware settings:
RX: 1024
RX Mini: 0
RX Jumbo: 0
TX: 1024
ethtool -l ens2f0
Channel parameters for ens2f0:
Pre-set maximums:
RX: 0
TX: 0
Other: 0
Combined: 60
Current hardware settings:
RX: 0
TX: 0
Other: 0
Combined: 60
VJ Updated by Victor Julien almost 7 years ago
- Tracker changed from Optimization to Support
VJ Updated by Victor Julien almost 7 years ago
Have you gone through #2725 to see if you can get rid of the wrong thread issue?
AH Updated by Andreas Herz almost 7 years ago
- Assignee set to Community Ticket
- Target version set to Support
SN Updated by Srijan Nandi almost 7 years ago
- File suricata.yaml suricata.yaml added
Did the changes as suggested, the only thing that I could not do is change hashing on a mellanox card. So the issue still remain with 60% packets going on a wrong stream.
I am also seeing these message in suricata.log:
[46071] 23/8/2019 -- 19:37:41 - (source-af-packet.c:803) <Warning> (AFPWritePacket) -- [ERRCODE: SC_ERR_SOCKET(200)] - Sending packet failed on socket 26: No buffer space available
[46071] 23/8/2019 -- 19:37:41 - (source-af-packet.c:803) <Warning> (AFPWritePacket) -- [ERRCODE: SC_ERR_SOCKET(200)] - Sending packet failed on socket 26: No buffer space available
[46071] 23/8/2019 -- 19:37:41 - (source-af-packet.c:803) <Warning> (AFPWritePacket) -- [ERRCODE: SC_ERR_SOCKET(200)] - Sending packet failed on socket 26: No buffer space available
[46071] 23/8/2019 -- 19:37:41 - (source-af-packet.c:803) <Warning> (AFPWritePacket) -- [ERRCODE: SC_ERR_SOCKET(200)] - Sending packet failed on socket 26: No buffer space available
[46071] 23/8/2019 -- 19:37:41 - (source-af-packet.c:803) <Warning> (AFPWritePacket) -- [ERRCODE: SC_ERR_SOCKET(200)] - Sending packet failed on socket 26: No buffer space available
SN Updated by Srijan Nandi almost 7 years ago
Below are my sysctl settings:
kernel.sched_migration_cost_ns = 5000000
net.core.netdev_budget = 2000
fs.file-max = 16486144
vm.swappiness = 10
vm.dirty_ratio = 10
vm.dirty_background_ratio = 2
vm.mmap_min_addr = 65536
vm.min_free_kbytes = 5280231
net.ipv4.route.flush = 1
net.ipv4.tcp_synack_retries = 2
net.ipv4.ip_local_port_range = 2000 65535
net.ipv4.tcp_rfc1337 = 1
net.ipv4.tcp_fin_timeout = 7
net.ipv4.tcp_max_tw_buckets = 66002432
net.ipv4.tcp_keepalive_time = 300
net.ipv4.tcp_keepalive_probes = 5
net.ipv4.tcp_keepalive_intvl = 15
net.ipv4.conf.default.rp_filter = 1
net.ipv4.tcp_sack = 1
net.ipv4.tcp_fack = 1
net.ipv4.tcp_timestamps = 0
net.ipv4.tcp_syncookies = 1
net.ipv4.icmp_echo_ignore_broadcasts = 1
net.ipv4.conf.all.accept_redirects = 0
net.ipv4.conf.all.log_martians = 0
net.core.optmem_max = 25165824
net.ipv4.tcp_max_orphans = 16384
net.ipv4.tcp_orphan_retries = 0
net.ipv4.tcp_window_scaling = 1
net.ipv4.tcp_no_metrics_save = 1
net.ipv4.tcp_mtu_probing = 1
net.ipv4.tcp_moderate_rcvbuf = 1
kernel.sysrq = 0
kernel.shmmax = 536870912000
kernel.shmall = 536870912000
kernel.msgmax = 65536
kernel.msgmnb = 65536
kernel.core_uses_pid = 1
kernel.pid_max = 65535
net.core.rmem_max = 2147483647
net.core.wmem_max = 2147483647
net.core.rmem_default = 2147483647
net.core.wmem_default = 2147483647
net.ipv4.tcp_rmem = 65536 12582912 2147483647
net.ipv4.tcp_wmem = 65536 12582912 2147483647
net.ipv4.udp_rmem_min = 268435456
net.ipv4.udp_wmem_min = 268435456
net.ipv4.tcp_mem = 2147483647 2147483647 2147483647
net.ipv4.udp_mem = 2147483647 2147483647 2147483647
net.ipv4.tcp_max_syn_backlog = 250000
net.core.somaxconn = 100000
net.core.netdev_max_backlog = 400000
net.ipv4.tcp_congestion_control = htcp
SN Updated by Srijan Nandi almost 7 years ago
rmmod mlx5_core && modprobe mlx5_core
ifconfig ens2f0 down
ifconfig ens2f1 down
/sbin/ethtool -L ens2f0 combined 40
/sbin/ethtool -L ens2f1 combined 40
/sbin/ethtool -K ens2f0 rxhash on
/sbin/ethtool -K ens2f1 rxhash on
/sbin/ethtool -K ens2f0 ntuple on
/sbin/ethtool -K ens2f1 ntuple on
ifconfig ens2f0 up
ifconfig ens2f1 up
/usr/sbin/set_irq_affinity_bynode.sh 1 ens2f0 ens2f1
/sbin/ethtool -X ens2f0 hkey 6D:5A:6D:5A:6D:5A:6D:5A:6D:5A:6D:5A:6D:5A:6D:5A:6D:5A:6D:5A:6D:5A:6D:5A:6D:5A:6D:5A:6D:5A:6D:5A:6D:5A:6D:5A:6D:5A:6D:5A equal 40
/sbin/ethtool -X ens2f1 hkey 6D:5A:6D:5A:6D:5A:6D:5A:6D:5A:6D:5A:6D:5A:6D:5A:6D:5A:6D:5A:6D:5A:6D:5A:6D:5A:6D:5A:6D:5A:6D:5A:6D:5A:6D:5A:6D:5A:6D:5A equal 40
/sbin/ethtool -A ens2f0 rx off tx off
/sbin/ethtool -A ens2f1 rx off tx off
/sbin/ethtool -C ens2f0 adaptive-rx off adaptive-tx off rx-usecs 125
/sbin/ethtool -C ens2f1 adaptive-rx off adaptive-tx off rx-usecs 125
/sbin/ethtool -G ens2f0 rx 8192
/sbin/ethtool -G ens2f0 tx 8192
/sbin/ethtool -G ens2f1 rx 8192
/sbin/ethtool -G ens2f1 tx 8192
for i in rx tx tso ufo gso gro lro tx sg txvlan rxvlan; do
echo " /sbin/ethtool -K ens2f0 $i off 2>&1 > /dev/null; "
/sbin/ethtool -K ens2f0 $i off 2>&1 > /dev/null;
done
for i in rx tx tso ufo gso gro lro tx sg txvlan rxvlan; do
echo " /sbin/ethtool -K ens2f1 $i off 2>&1 > /dev/null; "
/sbin/ethtool -K ens2f1 $i off 2>&1 > /dev/null;
done
echo toeplitz > /sys/class/net/ens2f0/settings/hfunc
echo toeplitz > /sys/class/net/ens2f1/settings/hfunc
PM Updated by Peter Manev almost 7 years ago
Can you please share your Suricata start line and your Trex start line?
Also can you please share your latest suricata.yaml with that above that you use for the testing - I see you have attached 3 but not sure if there is another one that is latest or diff version.
Are you testing IDS or IPS mode?
We have successful tests and community testing reports with 60Gb+ with Trex so I think the capability is there its a matter of adjusting the config part maybe.
SN Updated by Srijan Nandi almost 7 years ago
- File suricata.txt suricata.txt added
suricata start line:
/usr/bin/suricata -c /etc/suricata/suricata.yaml --af-packet --pidfile /var/run/suricata.pid -D
suricata.yaml:
File attached
Trex start line: (modified config)
./t-rex-64 -f cap2/http_simple_chetan.yaml -m 5.5 -d 1800
Trex modified config contains the following pcap files:
-- loading cap file avl/delay_10_https_0.pcap
-- loading cap file avl/delay_10_http_browsing_0.pcap
-- loading cap file avl/delay_10_smtp_0.pcap
-- loading cap file avl/delay_10_smtp_1.pcap
-- loading cap file avl/delay_10_smtp_2.pcap
-- loading cap file avl/delay_10_mail_pop_0.pcap
-- loading cap file avl/delay_10_mail_pop_1.pcap
-- loading cap file avl/delay_10_mail_pop_2.pcap
-- loading cap file avl/delay_10_exchange_0.pcap
-- loading cap file avl/delay_10_dns_0.pcap
-- loading cap file avl/delay_10_sip_video_call_full.pcap
-- loading cap file avl/delay_10_video_call_0.pcap
-- loading cap file avl/delay_10_http_get_0.pcap
-- loading cap file avl/delay_10_http_post_0.pcap
-- loading cap file avl/delay_10_citrix_0.pcap
-- loading cap file avl/delay_10_rtp_160k_full.pcap
-- loading cap file avl/delay_10_rtp_250k_full.pcap
I am running it in IPS mode.
With 30Gbps I see very less drops less than 1% but as I increase it to 40, 50 Gbps, I see huge drops. If I can get the packet drops down that will be good.
The other problem is packets going to the wrong thread. More than 50% traffic is going to the wrong thread.
tail -f /var/log/suricata/stats.log | grep "packets\|drops\|wrong"
capture.kernel_packets | Total | 946056239
capture.kernel_drops | Total | 543858
stream.wrong_thread | Total | 14115200
tcp.pkt_on_wrong_thread | Total | 495451081
capture.kernel_packets | Total | 947177622
capture.kernel_drops | Total | 543858
stream.wrong_thread | Total | 14115940
tcp.pkt_on_wrong_thread | Total | 495453021
SN Updated by Srijan Nandi almost 7 years ago
- File sysctl.conf sysctl.conf added
Also attached is the sysctl.conf file.
SN Updated by Srijan Nandi almost 7 years ago
With 30Gbps traffic, I am also getting these messages:
[3239] 28/8/2019 -- 02:35:53 - (source-af-packet.c:803) <Warning> (AFPWritePacket) -- [ERRCODE: SC_ERR_SOCKET(200)] - Sending packet failed on socket 80: No buffer space available
[3239] 28/8/2019 -- 02:35:53 - (source-af-packet.c:803) <Warning> (AFPWritePacket) -- [ERRCODE: SC_ERR_SOCKET(200)] - Sending packet failed on socket 80: No buffer space available
[3239] 28/8/2019 -- 02:35:53 - (source-af-packet.c:803) <Warning> (AFPWritePacket) -- [ERRCODE: SC_ERR_SOCKET(200)] - Sending packet failed on socket 80: No buffer space available
[3239] 28/8/2019 -- 02:35:53 - (source-af-packet.c:803) <Warning> (AFPWritePacket) -- [ERRCODE: SC_ERR_SOCKET(200)] - Sending packet failed on socket 80: No buffer space available
[3239] 28/8/2019 -- 02:35:53 - (source-af-packet.c:803) <Warning> (AFPWritePacket) -- [ERRCODE: SC_ERR_SOCKET(200)] - Sending packet failed on socket 80: No buffer space available
SN Updated by Srijan Nandi almost 7 years ago
- File suricata.yaml suricata.yaml added
- File sysctl.txt sysctl.txt added
- File nic_settings.txt nic_settings.txt added
- File Screenshot 2019-08-30 at 8.46.30 pm.png Screenshot 2019-08-30 at 8.46.30 pm.png added
Hello Everyone,
I changed my distro from Debian 9 to Ubuntu 18.04.3 LTS. Still not able to pass more than 25Gbps of traffic. I am getting around 1% packet loss. I am running suricata in af-packet mode with XDP support.
Below are the details of my setup.
DIstro: Ubuntu 18.04.3 LTS
Kernel Version: 4.19.0-041900-generic #201810221809 SMP Mon Oct 22 22:11:45 UTC 2018 x86_64 x86_64 x86_64 GNU/Linux
sysctl.conf: Attached.
suricata.yaml: Attached.
NIC Settings: Attached.
Hardware:
Architecture: x86_64
CPU op-mode(s): 32-bit, 64-bit
Byte Order: Little Endian
CPU: 80
On-line CPU list: 0-79
Thread(s) per core: 2
Core(s) per socket: 20
Socket(s): 2
NUMA node(s): 2
Vendor ID: GenuineIntel
CPU family: 6
Model: 85
Model name: Intel(R) Xeon(R) Gold 6138 CPU @ 2.00GHz
Stepping: 4
CPU MHz: 1961.642
CPU max MHz: 2000.0000
CPU min MHz: 1000.0000
BogoMIPS: 4000.00
NUMA Nodes:
NUMA node0 CPU: 0-19,40-59
NUMA node1 CPU: 20-39,60-79
NIC Card:
Mellanox ConnectX®-5 100GbE Single/Dual-Port Adapters
NIC Driver Details:
ethtool -i enp94s0f1
driver: mlx5_core
version: 4.6-1.0.1
firmware-version: 16.25.1020 (MT_0000000012)
expansion-rom-version:
bus-info: 0000:5e:00.1
supports-statistics: yes
supports-test: yes
supports-eeprom-access: no
supports-register-dump: no
supports-priv-flags: yes
NIC attached to NUMA Node:
cat /sys/class/net/enp94s0f0/device/numa_node
0
cat /sys/class/net/enp94s0f1/device/numa_node
0
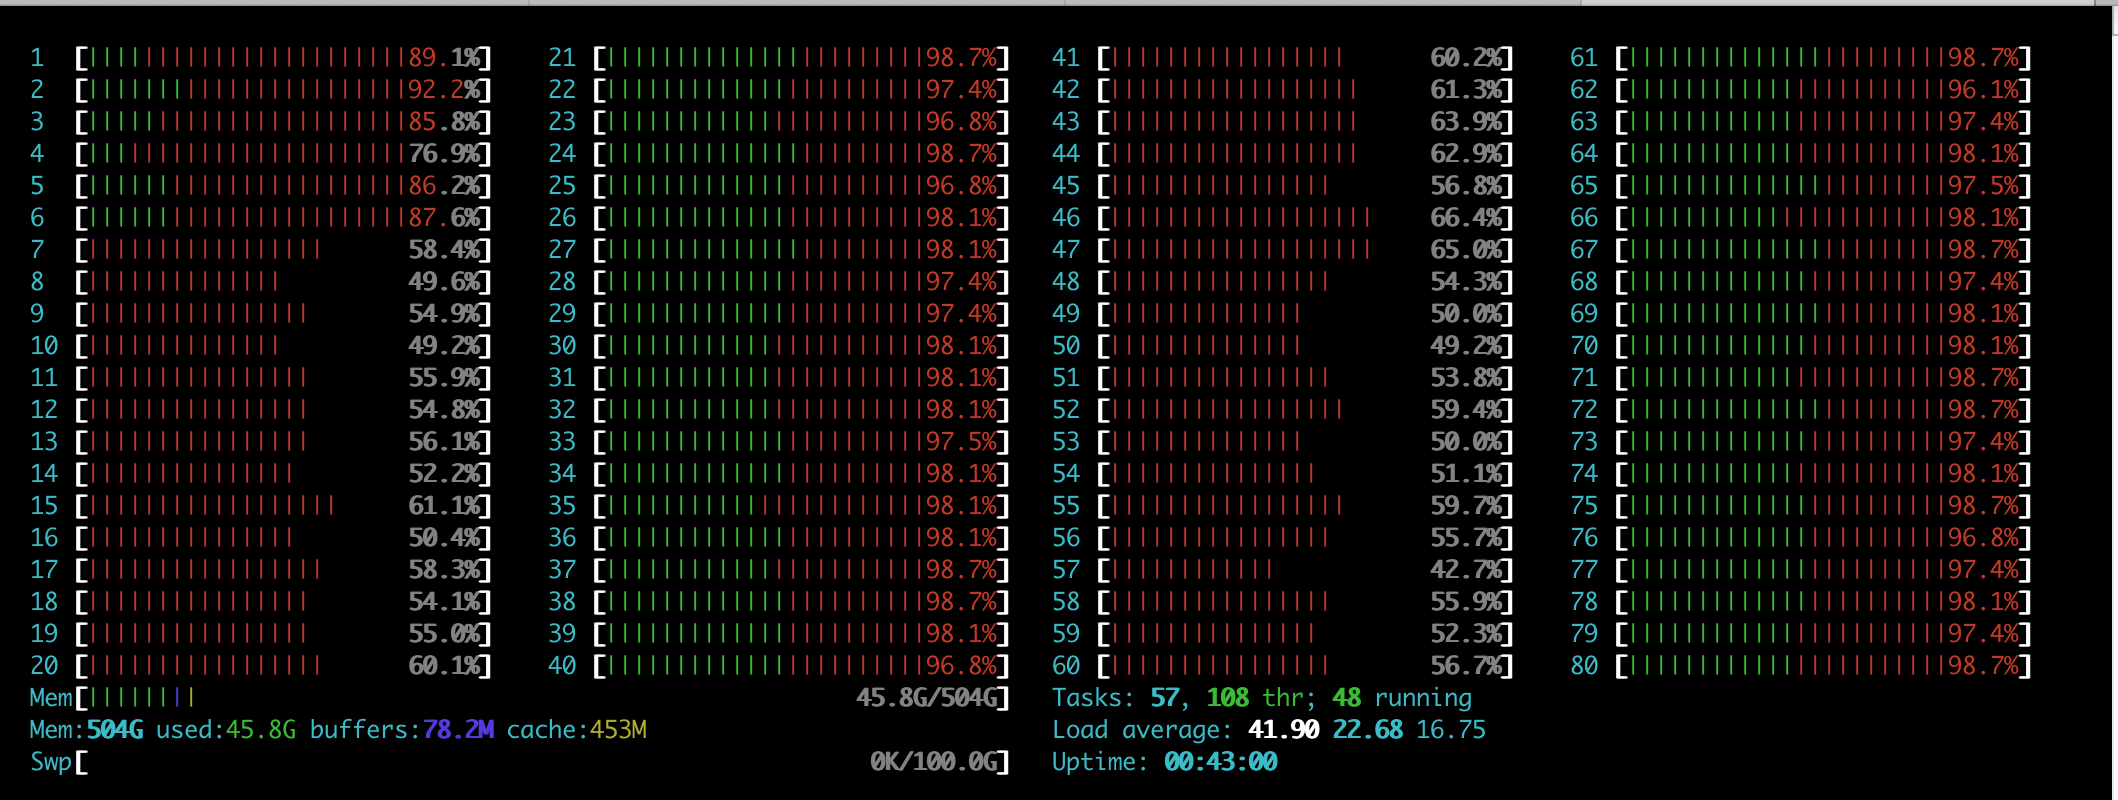
CPU percentage stays high. Attached is a screenshot when passing peak traffic. If I change NIC numa node to 1 and suricata also listening on numa node 1, then there is huge drop and throughput never crosses 1 Gbps for the 30 Gbps sent. The only setting that works is to make NIC listen on numa node 0 and suricata on numa node 1. Here I get the desired throughput, and packet drop is around 1%. I need to reduce packet drops to less than 1%.
Packet drop:
tail -f stats.log | grep "packets\|drops"
capture.kernel_packets | Total | 8132437046
capture.kernel_drops | Total | 55178228
capture.kernel_packets | Total | 8132437051
capture.kernel_drops | Total | 55178228
capture.kernel_packets | Total | 8142518488
capture.kernel_drops | Total | 55540119
capture.kernel_packets | Total | 8175087064
capture.kernel_drops | Total | 55760124
capture.kernel_packets | Total | 8218204575
capture.kernel_drops | Total | 56653234
I am using t-rex to test this,
T-Rex command:
./t-rex-64 -f avl/sfr_delay_10_1g.yaml -c 16 -m 30 -d 180 -p
I tried the following:
NIC Channel parameters: 40
NIC on NUMA 1, suricata on NUMA 0, 40 threads - Huge packet loss and low throughput
NIC on NUMA 1, suricata on NUMA 0 and 1, 60 threads - Huge packet loss and low throughput
NIC with no affinity, suricata on NUMA 0 and 1, 60 threads - Huge packet loss and low throughput
NIC with no affinity, suricata on NUMA 0 and 1, 40 threads - Huge packet loss and low throughput
NIC with no affinity, suricata with no affinity - Huge packet loss and low throughput
NIC on NUMA 0, suricata on NUMA 1, 40 threads - Less packet and high throughput (around 28-29 Gbps)
SN Updated by Srijan Nandi almost 7 years ago
Has anyone done more than 30 gbps...and got a decent result.
PM Updated by Peter Manev almost 7 years ago
I have never tried IPS mode on those speed neither i have played with 100G Mellanox NIC - but i have some suggestions a sthis is area that is very interesting to me :)
Can you try adding
 for proto in tcp4 udp4 tcp6 udp6; do
    /usr/local/sbin/ethtool -N eth1 rx-flow-hash $proto sd
 done
to your NIC port tuning.
Also adjust
"max-pending-packets" to 65000 in suricata.yaml
Can you please retest?
I think you are doing IPS tests with AFPv3 - is that correct? (just double checking - as afpv3 is not good for IPS mode)
VJ Updated by Victor Julien almost 7 years ago
As as side note: I think the 'wrong thread' detection is currently wrong for AF_PACKET IPS. Both sides are handled by different threads by definition.
SN Updated by Srijan Nandi almost 7 years ago
- File suricata.yaml suricata.yaml added
Thank you, Peter for the response.
AFPv3 has been disabled.
Let me brief you about the tests and their results.
1. max-pending packets changed to 65000
1st time - T-rex packet drop: 0.46% and suricata packet drop: 0.15%
2nd time - T-Rex packet drop: 0.25% and suricata packet drop: 0.11%
2. max-pending packets changed back to 1024
1st time - T-Rex packet drop: 0.23% and suricata packet drop: 0.08%
2nd time - T-Rex packet drop: 0.24% and suricata packet drop: 0.11%
Therefore, I assume, max-pending packets does not have much effect when the ring-size is set to a high number (500000, in my case).
Unfortunately, Mellanox NIC's don't have the option to set rx-flow-hash to 'sd'. I have reconfirmed this with Mellanox support as well.
My Conclusion:
1. On a 80 core CPU, running 40 threads of suricata on NUMA 1 and combined 40 of NIC on NUMA 0.
We can go up to 30 Gbps with 0(zero) ruleset and 20 Gbps with 20118 rules.
Any change in the above order, result in increase in packet drops.
I think, increasing cores on the CPU will result in increase in throughput with the same calculation. This way we can go for more throughput. I am actually aiming for around 40-50 Gbps by increasing the CPU cores.
PM Updated by Peter Manev almost 7 years ago
I am glad to here there is only 0.x% drops - initially i was reading and left with the impression the packet drop is huge.
Ok so this is 20 threads in/out total of 40.
Can you please upload a full verbose log (suricata.log and stats.log) from a full test run - from start to finish - when you do the test with the 20k ruleset?
Then the same but if you use 30 threads for each interface (aka 60 in total) with the rules.
Could you also please try the latest dev suricata
SC Updated by Sean Cloherty almost 7 years ago
I was looking at the worker threads CPUs assigned. Your post stated that the server has NUMA node0 CPU: 0-19,40-59 and NUMA node1 CPU: 20-39,60-79 and that your workers are assigned to 3-19 and 40-59 with 0,1,2 for the management set.
Assuming that CPUs 40-59 are hyperthreads of CPUs 1-19, you may want to avoid assigning workers to use the HT CPUs corresponding with busy CPUs (i.e. 0,1,2 & 40,41,42). So then it would be- worker-cpu-set: cpu: [ "3-19","43-59" ]
It probably won't make a huge difference, but if I understand the Intel architecture and the SEPTUN guide, it could help somewhat.
SN Updated by Srijan Nandi almost 7 years ago
- File suricata.yaml(40).txt suricata.yaml(40).txt added
- File suricata.log(40).txt suricata.log(40).txt added
- File stats.log(40).txt stats.log(40).txt added
- File suricata.yaml(60).txt suricata.yaml(60).txt added
- File suricata.log(60).txt suricata.log(60).txt added
- File stats.log(60).txt stats.log(60).txt added
Hello Peter,
Sorry for the late reply.
I did the tests.
Still I find less drops with 40 threads than going for 60 threads. I am attaching all the files here.
-=Srijan Nandi
Peter Manev wrote:
I am glad to here there is only 0.x% drops - initially i was reading and left with the impression the packet drop is huge.
Ok so this is 20 threads in/out total of 40.
Can you please upload a full verbose log (suricata.log and stats.log) from a full test run - from start to finish - when you do the test with the 20k ruleset?
Then the same but if you use 30 threads for each interface (aka 60 in total) with the rules.
Could you also please try the latest dev suricata
PM Updated by Peter Manev almost 7 years ago
Thank you for the provided output.
Looking at the stats - i see much more than 0.x % drops (what you originally reported) ?
Are these the configs from those tests ? (the stats here seem to be 4.5% drops?)
I also see lots of reassembly gaps and memecap drops - maybe try increasing stream.memecap settings?
tcp.segment_memcap_drop                       | Total                     | 76901544
tcp.reassembly_gap                            | Total                     | 9929389
You have that in the config -
  memcap: 1gb
  reassembly:
    memcap: 2gb
What is the reason for such low settings - compared to previous run utilizing 12Gb and 18Gb respectively ?
SN Updated by Srijan Nandi almost 7 years ago
I was playing around with all the settings and found out that increasing the stream.memecap and reassembly.memcap increased packet drops. I will update you with increased settings.
SN Updated by Srijan Nandi almost 7 years ago
Increasing stream.memcap to 12Gb and reassembly.memcap to 18 Gb, increases packet drops to 14%. However, I see no tcp.segment_memcap_drop's and no tcp.reassembly_gap's. Reducing these two, reduces the packet capture.kernel_drops, but increases segment memcap drop and tcp reassembly gap.
Therefore, I am again back to square one. The question still remains on how to get 20 Gbps or more throughput with 20118 rules with less packet drops. I can arrange for a remote session if anyone wants to have a look.
SN Updated by Srijan Nandi almost 7 years ago
- File suricata.yaml.txt suricata.yaml.txt added
- File stats-1.txt stats-1.txt added
The moment I increase stream.memcap and reassembly.memcap, capture.kernel_drops increases. But then there is no tcp.segment_memcap_drop and tcp.reassembly_gap. Increasing the stream and reassembly memcap values increases the capture.kernel_drops.
Attaching the latest suricata.yaml file and stats file, with the follwoing settings:
stream:
memcap: 4gb
checksum-validation: no # reject wrong csums
inline: no
prealloc-session: 10000000
bypass: yes
midstream: false
async-oneside: false
reassembly:
memcap: 10gb
depth: 12mb # reassemble 1mb into a stream
toserver-chunk-size: 2560
toclient-chunk-size: 2560
randomize-chunk-size: yes
PM Updated by Peter Manev almost 7 years ago
The number of prealloc sessions should not be that high - try 100 000.
Also try when you increase the memecap settings also increase max-pending-packets to 50 000.
Any diff ?
SN Updated by Srijan Nandi almost 7 years ago
Here are results of the changes made:
1st Test:
max-pending-packets: 65534
stream:
memcap: 4gb
checksum-validation: no # reject wrong csums
inline: no
prealloc-session: 100000
bypass: yes
midstream: false
async-oneside: false
reassembly:
memcap: 12gb
depth: 12mb # reassemble 1mb into a stream
toserver-chunk-size: 2560
toclient-chunk-size: 2560
randomize-chunk-size: yes
Statistics:
kernel drop: 1.43%
memcap drop: 0.94%
reassembly gap: 1.07%
stats.log:
capture.kernel_packets | Total | 2508066889
capture.kernel_drops | Total | 36386011
tcp.segment_memcap_drop | Total | 23665366
tcp.reassembly_gap | Total | 26618118
capture.kernel_packets | Total | 2542972194
capture.kernel_drops | Total | 36564757
tcp.segment_memcap_drop | Total | 24094683
tcp.reassembly_gap | Total | 27123889
capture.kernel_packets | Total | 2565617719
capture.kernel_drops | Total | 36782941
tcp.segment_memcap_drop | Total | 24238114
tcp.reassembly_gap | Total | 27341505
2nd Test:
max-pending-packets: 65534
stream:
memcap: 1gb
checksum-validation: no # reject wrong csums
inline: no
prealloc-session: 100000
bypass: yes
midstream: false
async-oneside: false
reassembly:
memcap: 2gb
depth: 12mb # reassemble 1mb into a stream
toserver-chunk-size: 2560
toclient-chunk-size: 2560
randomize-chunk-size: yes
Statistics:
kernel drop: 0.08%
memcap drop: 1.35%
reassembly gap: 0.50%
stats.log:
capture.kernel_packets | Total | 2213874022
capture.kernel_drops | Total | 1632574
tcp.segment_memcap_drop | Total | 30329583
tcp.reassembly_gap | Total | 11207928
capture.kernel_packets | Total | 2248498365
capture.kernel_drops | Total | 1651425
tcp.segment_memcap_drop | Total | 30650216
tcp.reassembly_gap | Total | 11399375
capture.kernel_packets | Total | 2283228245
capture.kernel_drops | Total | 1745436
tcp.segment_memcap_drop | Total | 31039058
tcp.reassembly_gap | Total | 11577246
3rd Test:
max-pending-packets: 1024
stream:
memcap: 1gb
checksum-validation: no # reject wrong csums
inline: no
prealloc-session: 100000
bypass: yes
midstream: false
async-oneside: false
reassembly:
memcap: 2gb
depth: 12mb # reassemble 1mb into a stream
toserver-chunk-size: 2560
toclient-chunk-size: 2560
randomize-chunk-size: yes
Statistics:
kernel drop: 0.09%
memcap drop: 1.27%
reassembly gap: 0.51%
stats.log:
capture.kernel_packets | Total | 2302641265
capture.kernel_drops | Total | 2062506
tcp.segment_memcap_drop | Total | 29270467
tcp.reassembly_gap | Total | 11817159
capture.kernel_packets | Total | 2336565007
capture.kernel_drops | Total | 2138102
tcp.segment_memcap_drop | Total | 29647300
tcp.reassembly_gap | Total | 12006520
capture.kernel_packets | Total | 2373182571
capture.kernel_drops | Total | 2172403
tcp.segment_memcap_drop | Total | 30151424
tcp.reassembly_gap | Total | 12209092
PM Updated by Peter Manev almost 7 years ago
Very well done - thank you for sharing the results.
Could you please try the Test 3 but adjust "depth: 1mb" ?
Would be awesome if you could compare tests 1/2/3 vs current/latest gitmaster? (essentially what will become Suricata 5.0)
What does your NIC settings look like with the current set up? (ethtool -k / ethtool -l / ethtool -S / ethtool -i / etc ..)
Thanks!
PM Updated by Peter Manev almost 7 years ago
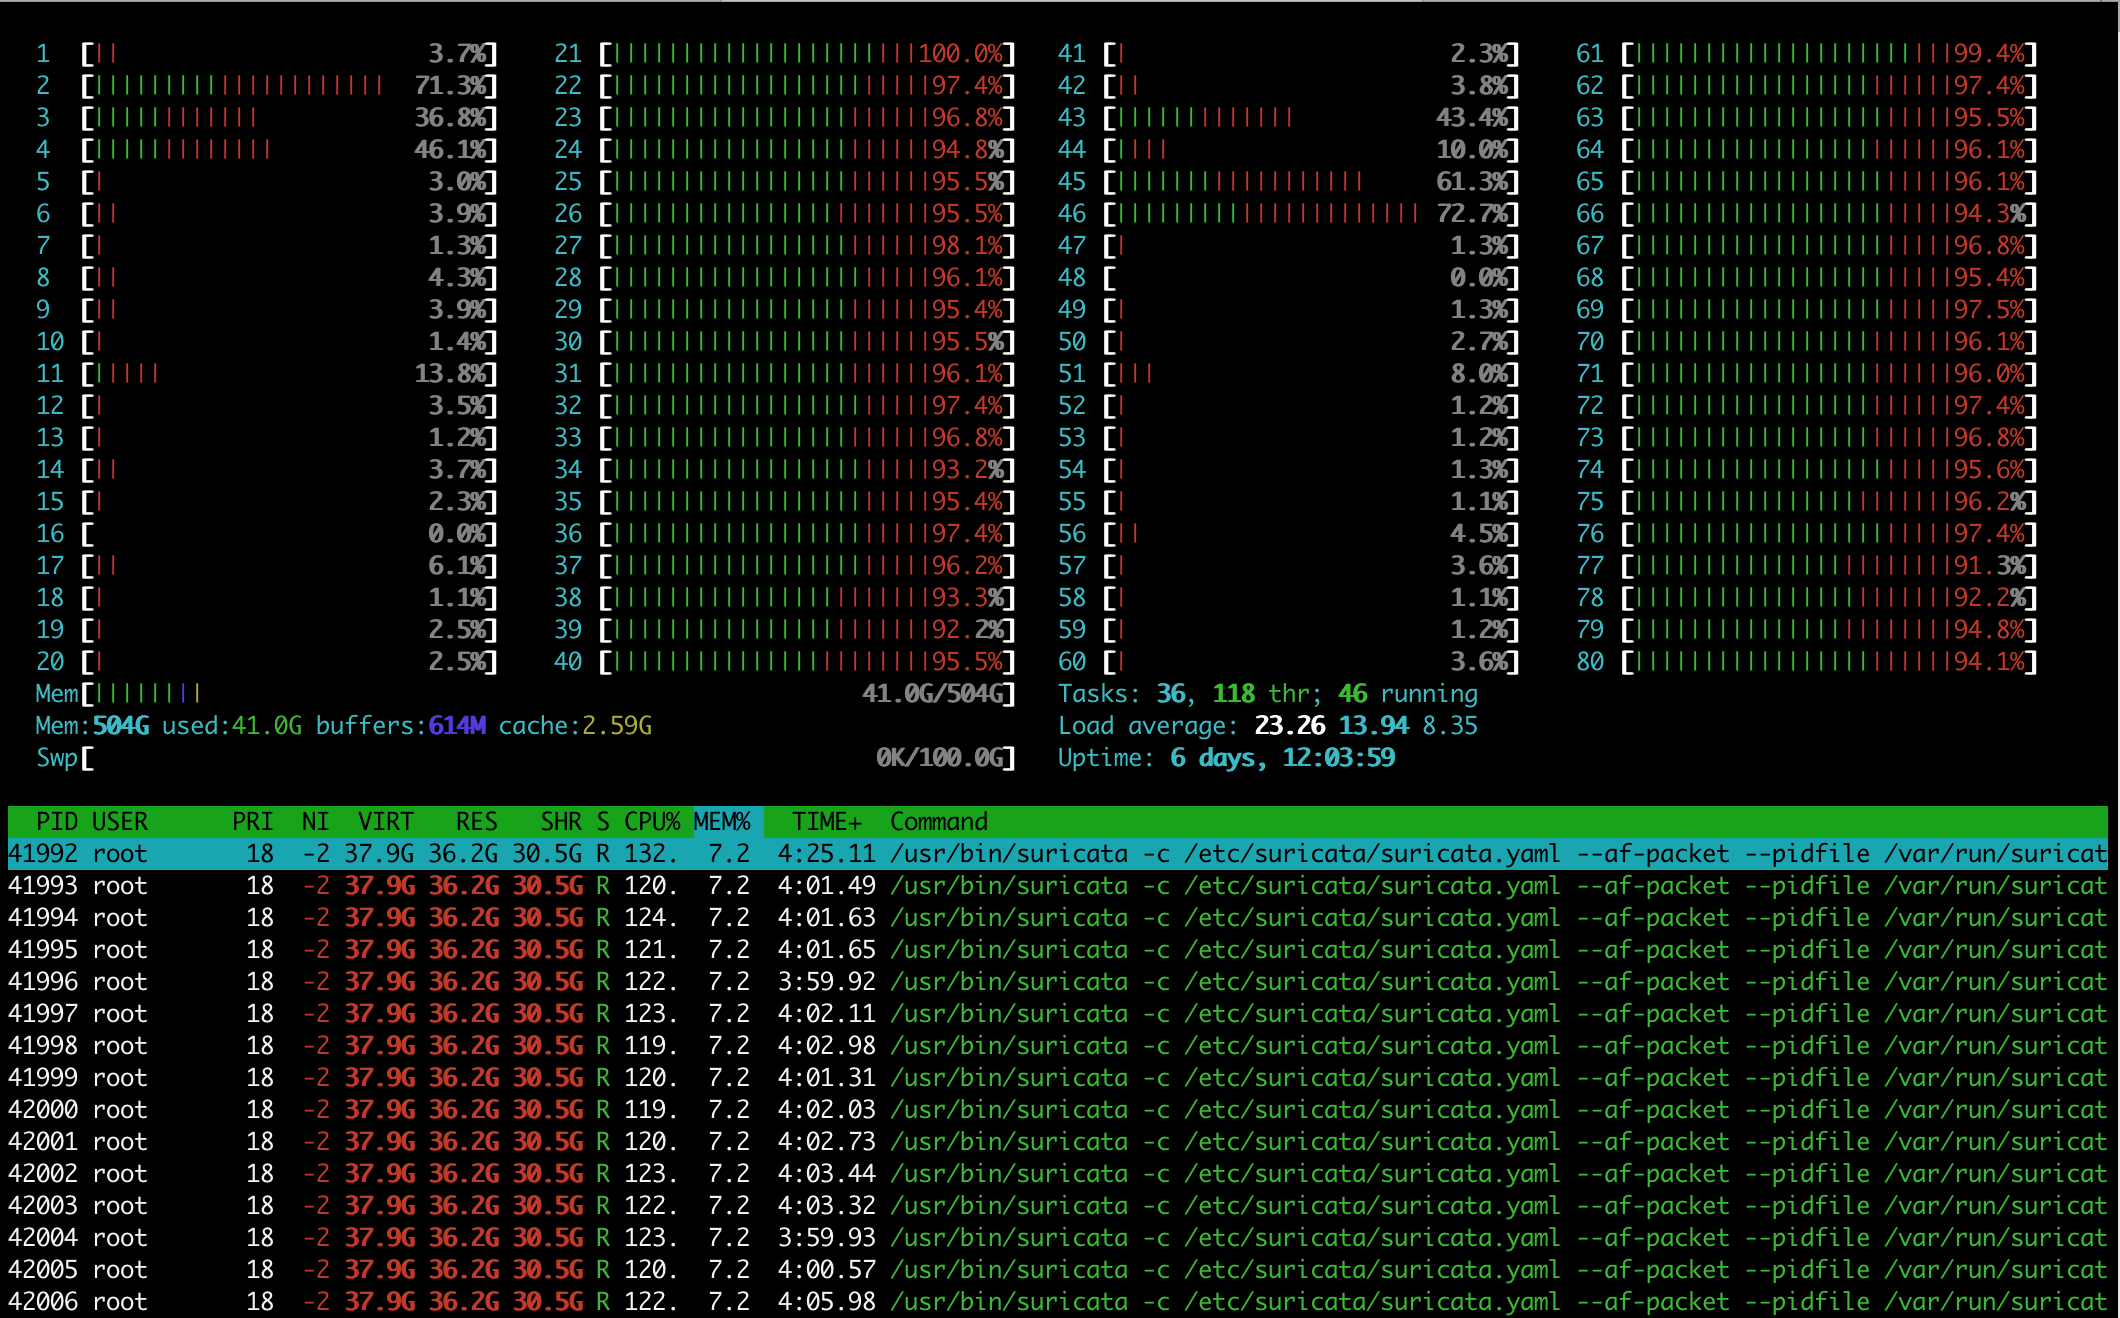
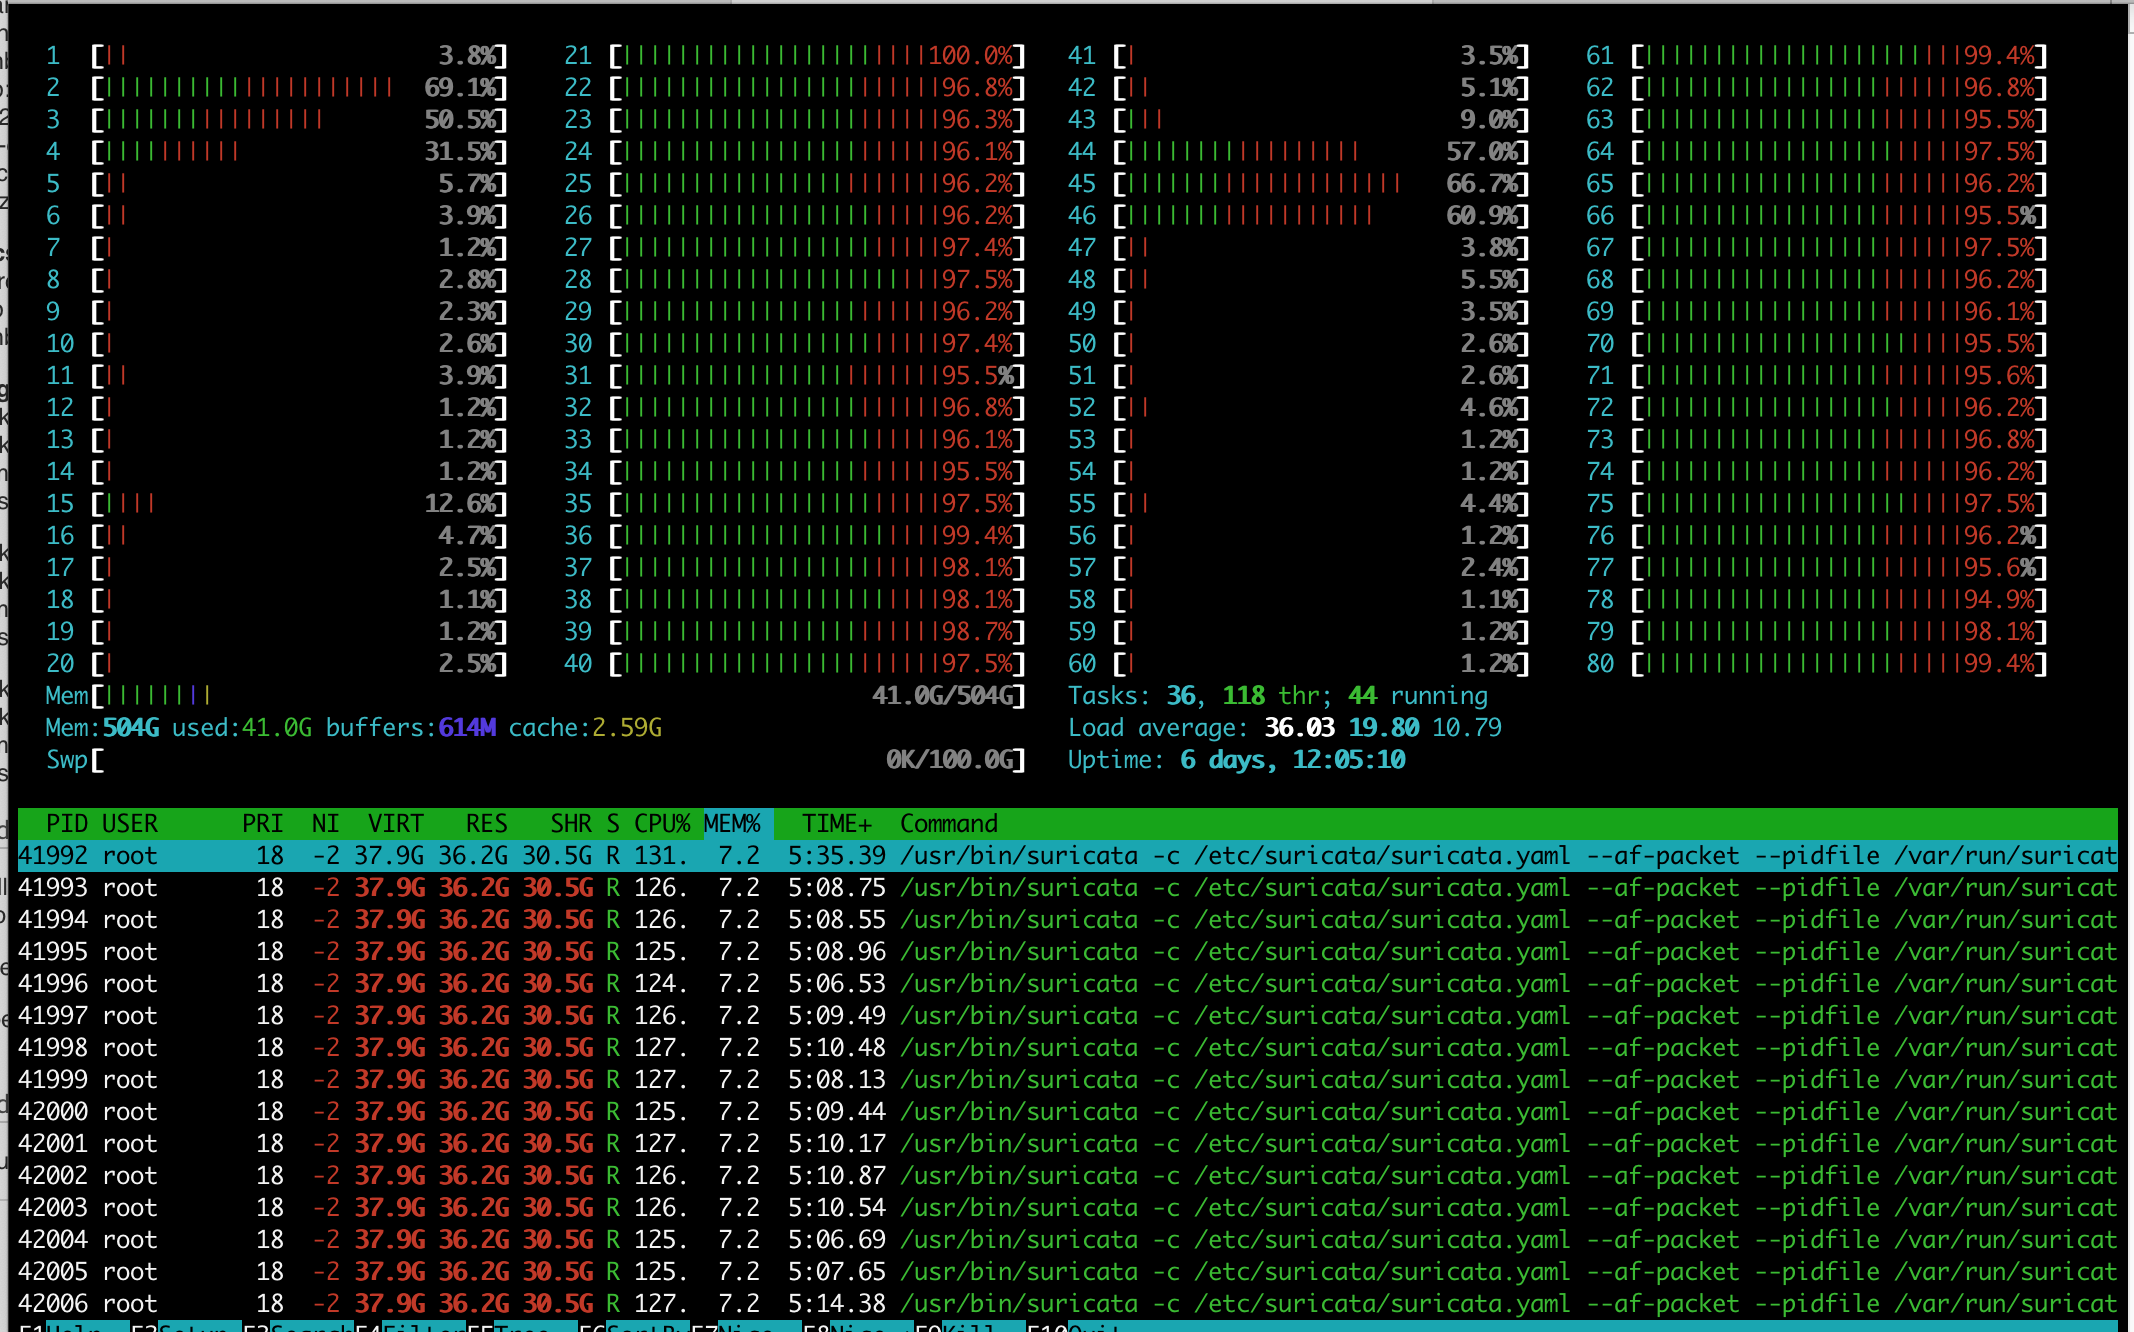
Also would be great if you could take a snapshot/screenshot of htop in the middle of the test and "top -H -p `pidof suricata`". Could help further the investigation.
SN Updated by Srijan Nandi almost 7 years ago
- File Screenshot 2019-09-22 at 12.12.57 am.png Screenshot 2019-09-22 at 12.12.57 am.png added
- File Screenshot 2019-09-22 at 12.14.07 am.png Screenshot 2019-09-22 at 12.14.07 am.png added
- File Screenshot 2019-09-22 at 12.13.34 am.png Screenshot 2019-09-22 at 12.13.34 am.png added
- File ethtool -i.txt ethtool -i.txt added
- File ethtool -k.txt ethtool -k.txt added
- File ethtool -l.txt ethtool -l.txt added
- File ethtool -S.txt ethtool -S.txt added
- File nic_settings.txt nic_settings.txt added
Ran the following test for 10 minutes straight with 20 Gbps traffic.
max-pending-packets: 1024
stream:
memcap: 1gb
checksum-validation: no # reject wrong csums
inline: no
prealloc-session: 100000
bypass: yes
midstream: false
async-oneside: false
reassembly:
memcap: 2gb
depth: 1mb # reassemble 1mb into a stream
toserver-chunk-size: 2560
toclient-chunk-size: 2560
randomize-chunk-size: yes
stats.log:
tail -f stats.log | grep "packets\|drop\|gap"
capture.kernel_packets | Total | 860659460
capture.kernel_drops | Total | 932572
tcp.segment_memcap_drop | Total | 15684501
tcp.reassembly_gap | Total | 4245555
capture.kernel_packets | Total | 1449317174
capture.kernel_drops | Total | 1430302
tcp.segment_memcap_drop | Total | 26576782
tcp.reassembly_gap | Total | 7340388
capture.kernel_packets | Total | 2723884920
capture.kernel_drops | Total | 5316941
tcp.segment_memcap_drop | Total | 42804694
tcp.reassembly_gap | Total | 13914706
capture.kernel_packets | Total | 3442359062
capture.kernel_drops | Total | 5883932
tcp.segment_memcap_drop | Total | 51755095
tcp.reassembly_gap | Total | 17600889
Statistics:
kernel drop: 0.17%
memcap drop: 1.50%
reassembly gap: 0.51%
Attached are the NIC settings and htop and top screenshots.
I had tried all the tests on Suricata version 5.0.0-dev, but faced Bug #3130. Therefore had to downgrade it to 4.1.4.
SN Updated by Srijan Nandi almost 7 years ago
Ran it again for 10 mins and here are the results.
stats.log:
capture.kernel_packets | Total | 3442359062
capture.kernel_drops | Total | 5883932
tcp.segment_memcap_drop | Total | 51755095
tcp.reassembly_gap | Total | 17600889
capture.kernel_packets | Total | 4479744747
capture.kernel_drops | Total | 6514104
tcp.segment_memcap_drop | Total | 51755095
tcp.reassembly_gap | Total | 17600889
capture.kernel_packets | Total | 5133907385
capture.kernel_drops | Total | 6711557
tcp.segment_memcap_drop | Total | 51755095
tcp.reassembly_gap | Total | 17600889
capture.kernel_packets | Total | 6024058693
capture.kernel_drops | Total | 6851562
tcp.segment_memcap_drop | Total | 51755095
tcp.reassembly_gap | Total | 17600889
Statistics:
kernel drop: 0.11%
memcap drop: 0.85%
reassembly gap: 0.29%
PM Updated by Peter Manev almost 7 years ago
ok.
What are the results if you use "cluster-type: cluster_qm" ? (including htop/top views?)
If you are hitting https://redmine.openinfosecfoundation.org/issues/3130 on a regular basis maybe you could compile with
./configure YOUR_USUAL_FLAGS CFLAGS="-ggdb -O0"
And then share the output of
# gdb /usr/local/bin/suricata /core
(gdb) set logging on
(gdb) thread apply all bt
Note: This will negatively impact the perf tests - it is just from the purpose of catching the bug.
SN Updated by Srijan Nandi almost 7 years ago
- File stats.xlsx stats.xlsx added
- File htop and top screenshots-1.docx htop and top screenshots-1.docx added
- File htop and top screenshots-2.docx htop and top screenshots-2.docx added
- File htop and top screenshots-3.docx htop and top screenshots-3.docx added
- File htop and top screenshots-4.docx htop and top screenshots-4.docx added
- File htop and top screenshots-5.docx htop and top screenshots-5.docx added
Hello Peter,
I did the test with culster_qm and cluster_flow, just to compare the results. All the 10 min tests were run with max-pending packets 65534 and 1024. Attached are the stats results along with the HTOP and top screenshots.
SN Updated by Srijan Nandi almost 7 years ago
After the completion of the above test, I ran the T-Rex test for 1 hour at 20 Gbps, with the following configuration:
cluster-type: cluster_flow
max-pending-packets: 1024
stream.memcap: 1Gb
reassembly.memcap: 2Gb
Start:
capture.kernel_packets 3597568728
capture.kernel_drops 6873170
tcp.segment_memcap_drop 47486313
tcp.reassembly_gap 16885239
Percentage capture.kernel_drops 0.19%
Percentage tcp.segment_memcap_drop 1.32%
Percentage tcp.reassembly_gap 0.47%
End:
capture.kernel_packets 18034765742
capture.kernel_drops 9465978
tcp.segment_memcap_drop 47486313
tcp.reassembly_gap 16885239
Percentage capture.kernel_drops 0.05%
Percentage tcp.segment_memcap_drop 0.26%
Percentage tcp.reassembly_gap 0.09%
PM Updated by Peter Manev almost 7 years ago
What was the stream depth ? (i did not see i tin the excel break down).
Last quotation (just before ) mentions cluster_flow - but in the excel break down you also have cluster_qm - was that form the latest runs too, correct?
Also were you able to reproduce the segfault with the debug flags enabled ?
SN Updated by Srijan Nandi almost 7 years ago
Peter Manev wrote:
What was the stream depth ? (i did not see i tin the excel break down).
stream depth for all the tests was 1mb.
Last quotation (just before ) mentions cluster_flow - but in the excel break down you also have cluster_qm - was that form the latest runs too, correct?
I tried with cluster_qm and cluster_flow and mentioned the results in the excel sheet for comparison. Because i was seeing less drops in cluster_flow therefore let it run for 1 hr. Thats the one mentioned in the last quotation.
Also were you able to reproduce the segfault with the debug flags enabled ?
I am yet to try the tests with latest dev release of 5.0.0
SN Updated by Srijan Nandi almost 7 years ago
- File htop and top screenshots htop and top screenshots added
- File stats-1.xlsx stats-1.xlsx added
Hello Peter,
I ran the test on 5.0.0-dev. And attached are the test results.
suricata --build-info
This is Suricata version 5.0.0-dev (178d420f3 2019-09-19)
Features: PCAP_SET_BUFF AF_PACKET HAVE_PACKET_FANOUT LIBCAP_NG LIBNET1.1 HAVE_HTP_URI_NORMALIZE_HOOK PCRE_JIT HAVE_NSS HAVE_LUA HAVE_LUAJIT HAVE_LIBJANSSON TLS MAGIC RUST
SIMD support: SSE_4_2 SSE_4_1 SSE_3
Atomic intrinsics: 1 2 4 8 16 byte(s)
64-bits, Little-endian architecture
GCC version 4.2.1 Compatible Clang 3.9.1 (tags/RELEASE_391/rc2), C version 199901
compiled with -fstack-protector
compiled with _FORTIFY_SOURCE=2
L1 cache line size (CLS)=64
thread local storage method: __thread
compiled with LibHTP v0.5.30, linked against LibHTP v0.5.30
All the tests were run for 10 minutes with reassembly depth of 1 mb.
AH Updated by Andreas Herz almost 7 years ago
What does the memory consumption look like? You could try to increase the prealloc settings especially to help with the higher rates at the beginning.
SN Updated by Srijan Nandi almost 7 years ago
Hello Andreas,
cat /proc/meminfo
MemTotal: 528017292 kB
MemFree: 487338968 kB
MemAvailable: 479212756 kB
Buffers: 172088 kB
Cached: 1246420 kB
free -h
total used free shared buff/cache available
Mem: 503G 37G 464G 2.5M 1.6G 457G
Swap: 99G 0B 99G
Memory usage never goes beyond 8-9%. I have set prealloc to 1000000, now. Still it starts with a kernel drop of 6-8% and then eventually lowers down to 0.80-0.95% after a 10 minute 20Gbps run.
Andreas Herz wrote:
What does the memory consumption look like? You could try to increase the prealloc settings especially to help with the higher rates at the beginning.
PM Updated by Peter Manev almost 7 years ago
I assume the last xls update was entirely with 5.0 right?
Can you try lowering the ring descriptors on the NIC to 1024 and rerun the 5.0 test if it is ok please? (feel free to add all of these in the xls with the Suricata versions so it is easier to compare)
Which Trex test yaml do you run?
(btw I cant seem to open the htop screenshot's attachment)
VJ Updated by Victor Julien almost 7 years ago
- Subject changed from help optimizing suircata in af-packet mode for 30gbps+ traffic to help optimizing suricata in af-packet mode for 30gbps+ traffic
PM Updated by Peter Manev almost 7 years ago
I would even suggest adding an "empty" run , with no rules to compare the differences.
SN Updated by Srijan Nandi almost 7 years ago
- File stats-1.xlsx stats-1.xlsx added
- File htop and top screenshots_compressed.pdf htop and top screenshots_compressed.pdf added
All the test were conducted in 5.0.0.
Suricata version 5.0.0-dev (178d420f3 2019-09-19)
I have updated the excel sheet with new tests by lowering the RX Ring buffer to 1024 from 8192 which was perviously used.
The T-Rex command that I am using is:
t-rex-64 -f avl/sfr_delay_10_1g.yaml -c 16 -m 20 -d 600 -p
The htop screenshot attachment was in Microsoft Docx format. I am attaching the same results as a pdf, this time.
Peter Manev wrote:
I assume the last xls update was entirely with 5.0 right?
Can you try lowering the ring descriptors on the NIC to 1024 and rerun the 5.0 test if it is ok please? (feel free to add all of these in the xls with the Suricata versions so it is easier to compare)
Which Trex test yaml do you run?
(btw I cant seem to open the htop screenshot's attachment)
SN Updated by Srijan Nandi almost 7 years ago
Now I am facing a very peculiar problem and I am not able to make any headway. I ran the above tests with 20118 rule. Then I disabled all the rules in the suricata.yaml file and kept on empty rule file enabled in suricata.yaml. I restarted suricata and now I am experiencing 95-96% packet drops.
capture.kernel_packets | Total | 2145910051
capture.kernel_drops | Total | 2005748060
capture.kernel_packets | Total | 2168778376
capture.kernel_drops | Total | 2026296072
capture.kernel_packets | Total | 2191145048
capture.kernel_drops | Total | 2045883204
I rebooted the server as well, but still no effect. If I enable all the rules, it is once again passing traffic and I am able to pass 20 Gbps. But as soon as I disable the rules, I can not go beyond 900 Mbps. Seems a bit strange.
SN Updated by Srijan Nandi almost 7 years ago
- File stats-1.xlsx stats-1.xlsx added
I could run the tests with a minimum of 307 rules. Anything below that is not giving good result, there is a huge packet drop.
With 307 rules enabled, I am attaching the test results.
PM Updated by Peter Manev almost 7 years ago
Thank you for the sum up.
Based on the spreadhseet - i see that the last three tests yield the best results. And the thing that sticks out to me atm is actually lowering the NIC ring descriptors to 1024.
Would it be possible tun cpl more tests (?):
- no rules at all
- 20k rules but with the NIC ring descriptors set to 512
- same last 3 tests from the spreadsheet but with a diff trex test profile (bigger mix etc of types of traffic etc)
Thank you
SN Updated by Srijan Nandi almost 7 years ago
- File stats-1.xlsx stats-1.xlsx added
Hello Peter,
I ran the tests with NIC ring descriptors set to 512. Results look good. But I am still unable to figure out as to why it doesn't work with 0 (zero) rules. I thought I could get 30+ Gbps with 0 (zero) rules, but that didn't happen.
PM Updated by Peter Manev almost 7 years ago
Could you post the stats log for the 0 rules run please?
SN Updated by Srijan Nandi almost 7 years ago
PM Updated by Peter Manev almost 7 years ago
The MTU on both interfaces is the same ?
SN Updated by Srijan Nandi almost 7 years ago
Yes, the MTU is same on both the interfaces.
enp94s0f0: <BROADCAST,MULTICAST,UP,LOWER_UP> mtu 3000 xdp/id:256 qdisc mq state UP group default qlen 1000
enp94s0f1: <BROADCAST,MULTICAST,UP,LOWER_UP> mtu 3000 xdp/id:259 qdisc mq state UP group default qlen 1000
AH Updated by Andreas Herz almost 6 years ago
Do you have the chance to test this with 6.0.0 (beta) again?
SN Updated by Srijan Nandi almost 6 years ago
The server is setup in production, cannot jeopardise it now. But will update if I get hold of a test environment.
AH Updated by Andreas Herz over 4 years ago
- Status changed from New to Closed
Hi, we're closing this issue since there have been no further responses.
If you think this issue is still relevant, try to test it again with the
most recent version of suricata and reopen the issue. If you want to
improve the bug report please take a look at
https://redmine.openinfosecfoundation.org/projects/suricata/wiki/Reporting_Bugs