Optimization #2725
openstream/packet on wrong thread
Description
Looking for feedback.
While investigating various research points with af-packet on live traffic and latest gitmaster (ex eedf08be/4.1) I noticed that I have never seen those to be 0 in any occasion
stream.wrong_thread                        | Total                     | 2982446
tcp.pkt_on_wrong_thread                    | Total                     | 156187846
Those statistics can be made available via - ( https://github.com/OISF/suricata/blob/master/suricata.yaml.in#L66 )
# global stats configuration
stats:
  enabled: yes
  # The interval field (in seconds) controls at what interval
  # the loggers are invoked.
  interval: 8
  # Add decode events as stats.
  decoder-events: true
  # Add stream events as stats.
  stream-events: true
I have tried different NICs/drivers(tested ixgbe/i40e), af-packet v3/v2, cluster_flow/cluster_cpu/cluster_qm, vlan tracking enabled or not, on different live traffic machines, different kernels (4.18/4.19) -
capture.kernel_drops and stream.wrong_thread are never 0 and always increasing.(it is more like 10-15% of the total in my test cases)
Looking for any feedback in terms of - if you are experiencing the same issue or not and what is your setup (if you would like to share).
Files
VJ Updated by Victor Julien over 7 years ago
- Tracker changed from Bug to Support
It could be interesting to check if having a single NIC queue helps.
It could be interesting how it works with PF_RING and NETMAP.
VJ Updated by Victor Julien over 7 years ago
Can you share a full stats.log record?
PM Updated by Peter Manev over 7 years ago
I could not test definitely with single RSS because the traffic was too much for one queue on all the live set ups I can test. Will try to reproduce that some other way on a slower machine.
It would also be interesting to see/confirm the issue is not present with dedicated or other HW - Netronome/Napatech/Mellanox/Accolade+pfring (that one I will test next week on and confirm)/ other ...
PM Updated by Peter Manev over 7 years ago
- File statslog.tar.gz statslog.tar.gz added
stats.log attached
VJ Updated by Victor Julien over 7 years ago
There is Teredo, ipv4-in-ipv6 and GRE tunneling. I wonder if those are handled correctly wrt AF_PACKETs load balancing.
PM Updated by Peter Manev over 7 years ago
Valid point I think.
I am supposed to get access to a replay set up next week and will do a few runs with those types of live traffic specifically to cover those cases as well. Will report back as soon as I got some findings on that.
VJ Updated by Victor Julien over 7 years ago
I wonder if as a test it would make sense to set a capture filter like just: tcp. I think this should rule out the tunnels.
Also, despite the perf concern I think it is still a good test to just use a single queue on the NIC, just to see if that affects the 'wrong_thread'.
PM Updated by Peter Manev over 7 years ago
An update:
Setup: - Af-packet config
suricata --dump-config |grep af-packet
af-packet = (null)
af-packet.0 = interface
af-packet.0.interface = enp59s0
af-packet.0.threads = 40
af-packet.0.cluster-id = 99
af-packet.0.cluster-type = cluster_flow
af-packet.0.defrag = yes
af-packet.0.xdp-mode = driver
af-packet.0.xdp-filter-file = /etc/suricata/xdp_filter.bpf
af-packet.0.bypass = yes
af-packet.0.use-mmap = yes
af-packet.0.mmap-locked = yes
af-packet.0.tpacket-v3 = yes
af-packet.0.ring-size = 300000
af-packet.0.block-size = 1048576
af-packet.1 = interface
af-packet.1.interface = default
NIC setup
ethtool -l enp59s0
Channel parameters for enp59s0:
Pre-set maximums:
RX:             0
TX:             0
Other:          1
Combined:       112
Current hardware settings:
RX:             0
TX:             0
Other:          1
Combined:       1
Case 1
Run command:
suricata -vvv --af-packet -S /opt/rules/*.rules --pidfile=/var/run/suricata.pid -F /var/log/suricata/bpf-vlan.filter
#bp filter
((ip and tcp port 80) or (vlan and tcp port 80))
So the "stream.wrong_thread" stay the same but "tcp.pkt_on_wrong_thread" are increasing
tail -F /var/log/suricata/stats.log  |grep -E "wrong_thread"

stream.wrong_thread                        | Total                     | 5093
tcp.pkt_on_wrong_thread                    | Total                     | 5671362
stream.wrong_thread                        | Total                     | 5093
tcp.pkt_on_wrong_thread                    | Total                     | 5713760
stream.wrong_thread                        | Total                     | 5093
tcp.pkt_on_wrong_thread                    | Total                     | 5757011
stream.wrong_thread                        | Total                     | 5093
tcp.pkt_on_wrong_thread                    | Total                     | 5798877
stream.wrong_thread                        | Total                     | 5093
tcp.pkt_on_wrong_thread                    | Total                     | 5844993
stream.wrong_thread                        | Total                     | 5093
tcp.pkt_on_wrong_thread                    | Total                     | 5890561
stream.wrong_thread                        | Total                     | 5093
tcp.pkt_on_wrong_thread                    | Total                     | 5938549
stream.wrong_thread                        | Total                     | 5093
tcp.pkt_on_wrong_thread                    | Total                     | 5977920
stream.wrong_thread                        | Total                     | 5093
tcp.pkt_on_wrong_thread                    | Total                     | 6018627
stream.wrong_thread                        | Total                     | 5093
tcp.pkt_on_wrong_thread                    | Total                     | 6061152
stream.wrong_thread                        | Total                     | 5093
tcp.pkt_on_wrong_thread                    | Total                     | 6100331
stream.wrong_thread                        | Total                     | 5093
tcp.pkt_on_wrong_thread                    | Total                     | 6136587
stream.wrong_thread                        | Total                     | 5093
tcp.pkt_on_wrong_thread                    | Total                     | 6174691
stream.wrong_thread                        | Total                     | 5093
tcp.pkt_on_wrong_thread                    | Total                     | 6207062
stream.wrong_thread                        | Total                     | 5093
tcp.pkt_on_wrong_thread                    | Total                     | 6245910
stream.wrong_thread                        | Total                     | 5093
tcp.pkt_on_wrong_thread                    | Total                     | 6280238
stream.wrong_thread                        | Total                     | 5093
tcp.pkt_on_wrong_thread                    | Total                     | 6319797
stream.wrong_thread                        | Total                     | 5093
tcp.pkt_on_wrong_thread                    | Total                     | 6351413
stream.wrong_thread                        | Total                     | 5093
tcp.pkt_on_wrong_thread                    | Total                     | 6389877
stream.wrong_thread                        | Total                     | 5093
tcp.pkt_on_wrong_thread                    | Total                     | 6427672
stream.wrong_thread                        | Total                     | 5093
tcp.pkt_on_wrong_thread                    | Total                     | 6468473
Case 2
Both "stream.wrong_thread" and "tcp.pkt_on_wrong_thread" are increasing.
Run command:
suricata -vvv --af-packet -S /opt/rules/*.rules --pidfile=/var/run/suricata.pid tcp port 80 --set vlan.use-for-tracking=false
tail -F /var/log/suricata/stats.log  |grep -E "wrong_thread"

stream.wrong_thread                        | Total                     | 5415
tcp.pkt_on_wrong_thread                    | Total                     | 975303
stream.wrong_thread                        | Total                     | 5788
tcp.pkt_on_wrong_thread                    | Total                     | 1599922
stream.wrong_thread                        | Total                     | 6206
tcp.pkt_on_wrong_thread                    | Total                     | 2002613
stream.wrong_thread                        | Total                     | 6570
tcp.pkt_on_wrong_thread                    | Total                     | 2324993
stream.wrong_thread                        | Total                     | 6979
tcp.pkt_on_wrong_thread                    | Total                     | 2595832
stream.wrong_thread                        | Total                     | 7437
tcp.pkt_on_wrong_thread                    | Total                     | 2816437
stream.wrong_thread                        | Total                     | 7804
tcp.pkt_on_wrong_thread                    | Total                     | 3046528
stream.wrong_thread                        | Total                     | 8130
tcp.pkt_on_wrong_thread                    | Total                     | 3231108
stream.wrong_thread                        | Total                     | 8505
tcp.pkt_on_wrong_thread                    | Total                     | 3393051
stream.wrong_thread                        | Total                     | 8825
tcp.pkt_on_wrong_thread                    | Total                     | 3500183
stream.wrong_thread                        | Total                     | 9196
tcp.pkt_on_wrong_thread                    | Total                     | 3617008
stream.wrong_thread                        | Total                     | 9519
tcp.pkt_on_wrong_thread                    | Total                     | 3715475
stream.wrong_thread                        | Total                     | 9911
tcp.pkt_on_wrong_thread                    | Total                     | 3816075
stream.wrong_thread                        | Total                     | 10289
tcp.pkt_on_wrong_thread                    | Total                     | 3927234
PM Updated by Peter Manev over 7 years ago
Same behavior as with AFP/Mellanox (MT27800 Family [ConnectX-5])
While PF_RING(cluster_flow)/Intel combo has "stream.wrong_thread" and "tcp.pkt_on_wrong_thread" counters increasing as well - it seems it is on a much smaller scale (0.00x% of the total pkts) during first test trials.
Continuing the investigation - will keep updating.
PM Updated by Peter Manev over 7 years ago
I have been able to pinpoint a reproducible case with having the "wrong_thread" counters present and increasing and then not present in a diff test case.
I have handed the test cases to Eric for feedback.
PM Updated by Peter Manev over 7 years ago
As an FYI
Tested/reproducible with the following kernels
Debian Stable with:
Linux suricata-ng01 4.18.0-0.bpo.1-amd64 #1 SMP Debian 4.18.6-1~bpo9+1 (2018-09-13) x86_64 GNU/Linux
Ubuntu LTS 16.04 with:
Linux suricata 4.18.6-amd64 #1 SMP Sat Sep 8 15:19:53 CEST 2018 x86_64 x86_64 x86_64 GNU/Linux
Also reported on Centos 7.6 on the user mailing list
https://lists.openinfosecfoundation.org/pipermail/oisf-users/2019-January/016527.html
I am currently trying some test runs to see if it is possible to pin point a possible direction of the issue.
PM Updated by Peter Manev over 7 years ago
Seems the problem is only present with af-packet using cluster_flow or cluster_cpu.
Using af-packet with cluster_qm with exact same number of threads and same numa node as on the NIC / NIC's queues - seems to be doing great on 30Gbps
Confirmed that with x710/i40 or Mellanox the counters are much lower almost insignificant (200 pkts wrong thread counter on 10 billion)-
 ethtool -i enp59s0
driver: i40e
version: 2.3.2-k
firmware-version: 5.05 0x8000291e 1.1313.0
expansion-rom-version:
bus-info: 0000:3b:00.0
supports-statistics: yes
supports-test: yes
supports-eeprom-access: yes
supports-register-dump: yes
supports-priv-flags: yes
ethtool -i enp94s0f0
driver: mlx5_core
version: 5.0-0
firmware-version: 16.23.1000 (MT_0000000012)
expansion-rom-version:
bus-info: 0000:5e:00.0
supports-statistics: yes
supports-test: yes
supports-eeprom-access: no
supports-register-dump: no
supports-priv-flags: yes
4.18.0-0.bpo.1-amd64 #1 SMP Debian 4.18.6-1~bpo9+1 (2018-09-13) x86_64 GNU/Linux
PM Updated by Peter Manev over 7 years ago
A simple table to start entering some stats -
| Issue Appears | OS/Distribution | Kernel Version | NIC/driver/version | runmode | Notes |
|---|---|---|---|---|---|
| NO | Debian Stretch | 4.18.0-0.bpo.1-amd64 | x710,i40, 2.3.2-k | AFP v3, cluster_qm | With Rust enabled and low entropy key |
| YES | Debian Stretch | 4.18.0-0.bpo.1-amd64 | x710,i40, 2.3.2-k | AFP v3, cluster_flow | With Rust enabled and low entropy key |
| YES | Debian Stretch | 4.18.0-0.bpo.1-amd64 | x710,i40, 2.3.2-k | AFP v3, cluster_cpu | With Rust enabled and low entropy key |
| NO | Debian Stretch | 4.18.0-0.bpo.1-amd64 | x710,i40, 2.3.2-k | PF_RING | With Rust enabled and low entropy key |
| NO | Debian Stretch | 4.18.0-0.bpo.1-amd64 | MT27800, mlx5_core, 5.0-0 | AFP v3, cluster_qm | With Rust enabled and low entropy key |
| YES | Debian Stretch | 4.18.0-0.bpo.1-amd64 | MT27800, mlx5_core, 5.0-0 | AFP v3, cluster_flow | With Rust enabled and low entropy key |
| YES | Debian Stretch | 4.18.0-0.bpo.1-amd64 | MT27800, mlx5_core, 5.0-0 | AFP v3, cluster_cpu | With Rust enabled and low entropy key |
| YES | Ubuntu LTS 18.04 | 4.18.6-amd64 | x520, 82599ES,ixgbe,5.1.0-k | AFP v3, cluster_qm | With Rust enabled and low entropy key |
| YES | Ubuntu LTS 18.04 | 4.18.6-amd64 | x520, 82599ES,ixgbe,5.1.0-k | AFP v3, cluster_flow | With Rust enabled and low entropy key |
| NO | Ubuntu LTS 18.04 | 4.18.6-amd64 | x520, 82599ES,ixgbe,5.1.0-k | PF_RING | With Rust enabled and low entropy key |
| NO | Debian Stretch 9.7 | 4.9.0-8-amd64 | x710, i40e, 1.6.16-k, fw 5.40 0x80002e8c 18.0.14 | AFP v3, cluster_qm | With Rust enabled and low entropy key. Offloading off, ntuple-filters: on, receive-hashing: on |
EU Updated by Eric Urban over 7 years ago
Peter, here is the requested info from the host with the logs stats-412_sur13_snf2.log-2019020616.gz that had a value of 100 for tcp.pkt_on_wrong_thread.
- We are running:
CentOS Linux release 7.6.1810 (Core)
- kernel (just uname -a)
Linux 3.10.0-957.5.1.el7.x86_64 #1 SMP Fri Feb 1 14:54:57 UTC 2019 x86_64 x86_64 x86_64 GNU/Linux
- ethtool -i iface
(Since we are running Myricom, I believe this is the equivalent to ethtool -i)
$ myri_nic_info -B
ProductCode Driver Version License
10G-PCIE2-8C2-2S myri_snf 3.0.15.50857 Valid
- runmode (example : af-packet cluster_flow / pfring )
pcap (using --pcap command-line option) capture method with workers runmode
- ethtool -x iface
(Since we are running Myricom, this is hopefully what you wanted from ethtool -x)
For quick reference, SNF_RSS_FLAGS = 49 (0x31) means SRC/DST addr and SRC/DST port.
$ SNF_DEBUG_MASK=3 /opt/snf/bin/tests/snf_simple_recv
91253 snf.0.-1 P (userset) SNF_PORTNUM = 0
91253 snf.0.-1 P (default) SNF_RING_ID = -1 (0xffffffff)
91253 snf.0.-1 P (default) SNF_NUM_RINGS = 1 (0x1)
91253 snf.0.-1 P (default) SNF_RSS_FLAGS = 49 (0x31)
91253 snf.0.-1 P (default) SNF_DATARING_SIZE = 268435456 (0x10000000) (256.0 MiB)
91253 snf.0.-1 P (default) SNF_DESCRING_SIZE = 134217728 (0x8000000) (128.0 MiB)
91253 snf.0.-1 P (default) SNF_FLAGS = 0
91253 snf.0.-1 P (environ) SNF_DEBUG_MASK = 3 (0x3)
91253 snf.0.-1 P (default) SNF_DEBUG_FILENAME = stderr
91253 snf.0.-1 P (default) SNF_APP_ID = -1 (0xffffffff)
91253 snf.0.-1 P SNF_DEBUG_MASK=0x3 for modes WARN=0x1, PARAM=0x2 QSTATS=0x4 TIMESYNC=0x8 IOCTL=0x10 QEVENTS=0x20 ARISTA=0x40
91253 snf.0.-1 P lib version=3.0.15.50857 build=snf-3.0.15.50857_e2bb46352 11/13/18_15:34 e2bb46352
91253 snf.0.-1 P kernel version=3.0.15.50857 build=snf-3.0.15.50857_e2bb46352 11/13/18_15:34 e2bb46352
91253 snf.0.-1 P pqstate [ 0x7f04b97cc000.. 0x7f04b97ce000) size 8 KiB 8192 (0x2000)
91253 snf.0.-1 P desc_ring [ 0x7f0438dbd000.. 0x7f04b8dbd000) size 2048 MiB 2147483648 (0x80000000)
91253 snf.0.-1 P data_ring [ 0x7f0238dad000.. 0x7f0438dbd000) size 8192 MiB 8590000128 (0x200010000)
91253 snf.0.-1 P pq_init: desc[seq=99,ev_idx=3412634,cnt=32115004058]
AH Updated by Andreas Herz over 7 years ago
- Assignee set to OISF Dev
- Target version set to Support
PM Updated by Peter Manev over 7 years ago
Thanks Eric for the info.
I have updated the table below:| Issue Appears | OS/Distribution | Kernel Version | NIC/driver/version | runmode | Notes |
|---|---|---|---|---|---|
| NO | Debian Stretch | 4.18.0-0.bpo.1-amd64 | x710,i40, 2.3.2-k | AFP v3, cluster_qm | With Rust, Toeplitz hash function, low entropy key. Offloading off, ntuple-filters: on, receive-hashing: on |
| YES | Debian Stretch | 4.18.0-0.bpo.1-amd64 | x710,i40, 2.3.2-k | AFP v3, cluster_flow | With Rust, Toeplitz hash function, low entropy key. Offloading off, ntuple-filters: on, receive-hashing: on |
| YES | Debian Stretch | 4.18.0-0.bpo.1-amd64 | x710,i40, 2.3.2-k | AFP v3, cluster_cpu | With Rust, Toeplitz hash function, low entropy key. Offloading off, ntuple-filters: on, receive-hashing: on |
| NO | Debian Stretch | 4.18.0-0.bpo.1-amd64 | x710,i40, 2.3.2-k | PF_RING | With Rust, Toeplitz hash function, low entropy key. Offloading off, ntuple-filters: on, receive-hashing: on |
| NO | Debian Stretch | 4.18.0-0.bpo.1-amd64 | MT27800, mlx5_core, 5.0-0 | AFP v3, cluster_qm | With Rust, Toeplitz hash function, low entropy key. Offloading off, ntuple-filters: on, receive-hashing: on |
| YES | Debian Stretch | 4.18.0-0.bpo.1-amd64 | MT27800, mlx5_core, 5.0-0 | AFP v3, cluster_flow | With Rust, Toeplitz hash function, low entropy key. Offloading off, ntuple-filters: on, receive-hashing: on |
| YES | Debian Stretch | 4.18.0-0.bpo.1-amd64 | MT27800, mlx5_core, 5.0-0 | AFP v3, cluster_cpu | With Rust, Toeplitz hash function, low entropy key. Offloading off, ntuple-filters: on, receive-hashing: on |
| YES | Ubuntu LTS 18.04 | 4.18.6-amd64 | x520, 82599ES,ixgbe,5.1.0-k | AFP v3, cluster_qm | With Rust, Toeplitz hash function, low entropy key. Offloading off, ntuple-filters: on, receive-hashing: on |
| YES | Ubuntu LTS 18.04 | 4.18.6-amd64 | x520, 82599ES,ixgbe,5.1.0-k | AFP v3, cluster_flow | With Rust, Toeplitz hash function, low entropy key. Offloading off, ntuple-filters: on, receive-hashing: on |
| NO | Ubuntu LTS 18.04 | 4.18.6-amd64 | x520, 82599ES,ixgbe,5.1.0-k | PF_RING | With Rust, Toeplitz hash function, low entropy key. Offloading off, ntuple-filters: on, receive-hashing: on |
| YES | Ubuntu LTS 18.04 | 4.18.6-amd64 | x520, 82599ES,ixgbe,5.1.0-k | AFP v3, cluster_flow | With Rust, 1 RSS queue only, Offloading off, ntuple-filters: of, receive-hashing: off. Only tcp.pkt_on_wrong_thread observed. |
| YES | CentOS Linux release 7.6.1810 | 3.10.0-957.1.3.el7.x86_64 | x520, 82599ES,ixgbe,5.5.2 | AFP v3, cluster_flow | With Rust, 1 RSS queue only, Offloading off, ntuple-filters: of, receive-hashing: off. Only tcp.pkt_on_wrong_thread observed. |
| NO | CentOS Linux release 7.6.1810 | 3.10.0-957.5.1.el7.x86_64 | 10G-PCIE2-8C2-2S myri_snf 3.0.15.50857 | pcap capture method with workers runmode | With Rust |
| NO | Debian Stretch 9.7 | 4.9.0-8-amd64 | x710, i40e, 1.6.16-k, fw 5.40 0x80002e8c 18.0.14 | AFP v3, cluster_qm | With Rust enabled and low entropy key. Offloading off, ntuple-filters: on, receive-hashing: on |
Looking at the above it appears:
- PF_RING does not have the problem
- newer models of NICs - x710/ Mellanox with AFPv3, cluster_qm amd toeplitz hash with low entropy key do not have the problem
- Myricom with pcap mode does not have the problem
- AFPv3 cluster flow even with forced 1 RSS on the NIC reports a problem
VJ Updated by Victor Julien over 7 years ago
- Related to Support #2900: alert 'SURICATA STREAM pkt seen on wrong thread' when run mode set to workers added
AH Updated by Andreas Herz about 7 years ago
Peter can you share more config details about the first entry of the table? I have tested that configuration (same debian kernel, x710 and runmode) and the wrong_thread counter is starting to grow a bit faster as with cluster_flow :( but the packet drop percentage decreased a bit.
I just want to make sure we didn't miss another configuration setting.
PM Updated by Peter Manev about 7 years ago
For example -
- 16 queues on the NIC, Low entropy key is a must and symmetric hashing is a must
- 16 worker afpacket threads with cluster_qm
AH Updated by Andreas Herz about 7 years ago
Unless I missed something it didn't change much on our setup with same debian, kernel etc. (did ifdown/up after changes with ethtool), will post a bit more details:
CPU: 2*Intel(R) Xeon(R) Silver 4114 CPU @ 2.20GHz
Memory: 96GB
NIC for Monitoring: X710 for 10GbE SFP+
config
af-packet:
  - interface: enp94s0f1
    threads: 16
    cluster-id: 98
    cluster-type: cluster_qm
    defrag: yes
    rollover: yes
    use-mmap: yes
    tpacket-v3: yes
    use-emergency-flush: yes
eththool settings:
driver: i40e
version: 2.3.2-k
firmware-version: 5.05 0x80002927 1.1313.0
Current hardware settings:
RX:        0
TX:        0
Other:        1
Combined:    16
RX flow hash indirection table for enp94s0f1 with 40 RX ring(s):
    0:      0     1     2     3     4     5     6     7
    8:      8     9    10    11    12    13    14    15
    16:      0     1     2     3     4     5     6     7
    24:      8     9    10    11    12    13    14    15
...
RSS hash key:
6d:5a:6d:5a:6d:5a:6d:5a:6d:5a:6d:5a:6d:5a:6d:5a:6d:5a:6d:5a:6d:5a:6d:5a:6d:5a:6d:5a:6d:5a:6d:5a:6d:5a:6d:5a:6d:5a:6d:5a:6d:5a:6d:5a:6d:5a:6d:5a:6d:5a:6d:5a
Current hardware settings:
RX:        512
RX Mini:    0
RX Jumbo:    0
TX:        512
Cannot get device udp-fragmentation-offload settings: Operation not supported
rx-checksumming: on
tx-checksumming: on
    tx-checksum-ipv4: on
    tx-checksum-ip-generic: off [fixed]
    tx-checksum-ipv6: on
    tx-checksum-fcoe-crc: off [fixed]
    tx-checksum-sctp: on
scatter-gather: off
    tx-scatter-gather: off
    tx-scatter-gather-fraglist: off [fixed]
tcp-segmentation-offload: off
    tx-tcp-segmentation: off
    tx-tcp-ecn-segmentation: off
    tx-tcp-mangleid-segmentation: off
    tx-tcp6-segmentation: off
udp-fragmentation-offload: off
generic-segmentation-offload: off
generic-receive-offload: off
large-receive-offload: off [fixed]
rx-vlan-offload: on
tx-vlan-offload: on
ntuple-filters: on
receive-hashing: on
highdma: on
rx-vlan-filter: on [fixed]
vlan-challenged: off [fixed]
tx-lockless: off [fixed]
netns-local: off [fixed]
tx-gso-robust: off [fixed]
tx-fcoe-segmentation: off [fixed]
tx-gre-segmentation: on
tx-gre-csum-segmentation: on
tx-ipxip4-segmentation: off [fixed]
tx-ipxip6-segmentation: off [fixed]
tx-udp_tnl-segmentation: on
tx-udp_tnl-csum-segmentation: on
tx-gso-partial: on
tx-sctp-segmentation: off [fixed]
tx-esp-segmentation: off [fixed]
tx-udp-segmentation: off [fixed]
fcoe-mtu: off [fixed]
tx-nocache-copy: off
loopback: off [fixed]
rx-fcs: off [fixed]
rx-all: off [fixed]
tx-vlan-stag-hw-insert: off [fixed]
rx-vlan-stag-hw-parse: off [fixed]
rx-vlan-stag-filter: off [fixed]
l2-fwd-offload: off [fixed]
hw-tc-offload: off
esp-hw-offload: off [fixed]
esp-tx-csum-hw-offload: off [fixed]
rx-udp_tunnel-port-offload: on
tls-hw-tx-offload: off [fixed]
rx-gro-hw: off [fixed]
tls-hw-record: off [fixed]
We also did set the irq affinity and watching /proc/interrupts confirms that it's set correct, only one column is updated.
We only saw a much reduced drop rate on the NIC level but on the kernel level (capture.kernel_drops) it's still a lot and the wrong_thread counter also very high.
VJ Updated by Victor Julien about 7 years ago
Andreas you could try upgrading the cards firmware. In the entry that I added we had fw 5.40. The customer had issues with an older version. Not sure if that was related, but it might be worth a shot.
PM Updated by Peter Manev about 7 years ago
@ Andreas - one more question (in additions to Victor's)- what is the RSS hashing function? aka in the example below it is Toeplitz
/usr/local/sbin/ethtool --show-rxfh  enp94s0f0
RX flow hash indirection table for enp94s0f0 with 40 RX ring(s):
    0:      0     1     2     3     4     5     6     7
    8:      8     9    10    11    12    13    14    15
   16:     16    17    18    19    20    21    22    23
   24:     24    25    26    27    28    29    30    31
   32:     32    33    34    35    36    37    38    39
   40:      0     1     2     3     4     5     6     7
   48:      8     9    10    11    12    13    14    15
   56:     16    17    18    19    20    21    22    23
   64:     24    25    26    27    28    29    30    31
   72:     32    33    34    35    36    37    38    39
   80:      0     1     2     3     4     5     6     7
   88:      8     9    10    11    12    13    14    15
   96:     16    17    18    19    20    21    22    23
  104:     24    25    26    27    28    29    30    31
  112:     32    33    34    35    36    37    38    39
  120:      0     1     2     3     4     5     6     7
RSS hash key:
    6d:5a:6d:5a:6d:5a:6d:5a:6d:5a:6d:5a:6d:5a:6d:5a:6d:5a:6d:5a:6d:5a:6d:5a:6d:5a:6d:5a:6d:5a:6d:5a:6d:5a:6d:5a:6d:5a:6d:5a
RSS hash function:
    toeplitz: on
    xor     : off
    crc32   : off
AH Updated by Andreas Herz about 7 years ago
@Victor good point, we have another system with 6.01 firmware, will try to see if the changes are more promising there.
@Peter:
RX flow hash indirection table for enp94s0f1 with 16 RX ring(s):
    0:      0     1     2     3     4     5     6     7
    8:      8     9    10    11    12    13    14    15
   16:      0     1     2     3     4     5     6     7
   24:      8     9    10    11    12    13    14    15
RSS hash key:
6d:5a:6d:5a:6d:5a:6d:5a:6d:5a:6d:5a:6d:5a:6d:5a:6d:5a:6d:5a:6d:5a:6d:5a:6d:5a:6d:5a:6d:5a:6d:5a:6d:5a:6d:5a:6d:5a:6d:5a:6d:5a:6d:5a:6d:5a:6d:5a:6d:5a:6d:5a
RSS hash function:
    toeplitz: on
    xor: off
    crc32: off
AH Updated by Andreas Herz about 7 years ago
Sadly no diff with the 6.01 firmware, counter increasing right from the start. Memory usage is fine (~50%), load is fine (15 load on 40 cores).
Maybe we can reproduce it in a lab environment so we could run suricata in debug mode to see the exact thread_ids. So far we only suspect the traffic on the live systems being another issue.
PM Updated by Peter Manev about 7 years ago
How are they increasing - can you provide some stats over time compared to total number of packets?
I have seen similar - but very minor increase, almost negligent to the number/volume of total packets. The difference in terms of number of packets on the wrong thread before and after the config changes described was big though (for the better- much lower)
AH Updated by Andreas Herz about 7 years ago
- File wrong_threads.png wrong_threads.png added
I could but it's also quite good to be seen in the picture attached. The changes I did throughout the day didn't change much on the overall issue.
PM Updated by Peter Manev about 7 years ago
What Suricata version is that ? (apologies if I missed the info before)
AH Updated by Andreas Herz about 7 years ago
4.1.2 in that case, as soon as it's in the repo we can bump it to 4.1.4
PM Updated by Peter Manev about 7 years ago
Any chance you can try latest git ?
PM Updated by Peter Manev about 7 years ago
Reading through the info again it seems something might be different in your setup.
In all the latest cases I’ve tested I always did it with latest git. However your traffic type might differ so I was wondering besides trying out git , can you try looking at different traffic patterns within the same traffic to try to see if any difference would be noticeable? For example run Suri with BPF “port 25” , then try “port 80” etc... (of course make sure to cover for the vlan part of the BPF if vlan is présent in the traffic ).
AH Updated by Andreas Herz about 7 years ago
So some update on this issue:
- We finally got it reproduced in a lab environment \o/
- We also updated the X710 firmware to the most recent 6.80 -> no measurable change
- We also used isolcpus (see /proc/cmdline) and cpu affinity settings to force the cpu cores -> no measurable change
What I can see is that the isolcpus, irq affinity etc. work since only those cpu cores included in the configuration are used but within them there seems to be the issue. IRQ Affinity looks as expected and wanted, counter increase on a dedicated cpu core for each queue.
- We also tried 5.0 beta1, no change with as well
I enabled debug (--enable-debug) and so far I don't see a obvious scheme but this is what it looked like in a test run:
7/5/2019 -- 09:49:58 - <Debug> - wrong thread: flow has 8, we are 11
7/5/2019 -- 09:49:58 - <Debug> - wrong thread: flow has 8, we are 2
7/5/2019 -- 09:49:58 - <Debug> - wrong thread: flow has 8, we are 3
7/5/2019 -- 09:49:58 - <Debug> - wrong thread: flow has 8, we are 14
7/5/2019 -- 09:49:58 - <Debug> - wrong thread: flow has 8, we are 3
7/5/2019 -- 09:49:58 - <Debug> - wrong thread: flow has 8, we are 14
7/5/2019 -- 09:49:58 - <Debug> - wrong thread: flow has 8, we are 3
7/5/2019 -- 09:49:58 - <Debug> - wrong thread: flow has 8, we are 14
7/5/2019 -- 09:49:58 - <Debug> - wrong thread: flow has 8, we are 12
7/5/2019 -- 09:49:58 - <Debug> - wrong thread: flow has 8, we are 14
7/5/2019 -- 09:49:58 - <Debug> - wrong thread: flow has 8, we are 12
7/5/2019 -- 09:49:58 - <Debug> - wrong thread: flow has 8, we are 1
7/5/2019 -- 09:49:58 - <Debug> - wrong thread: flow has 8, we are 9
7/5/2019 -- 09:49:58 - <Debug> - wrong thread: flow has 8, we are 7
7/5/2019 -- 09:49:58 - <Debug> - wrong thread: flow has 8, we are 11
7/5/2019 -- 09:49:58 - <Debug> - wrong thread: flow has 8, we are 2
7/5/2019 -- 09:49:58 - <Debug> - wrong thread: flow has 8, we are 11
7/5/2019 -- 09:49:58 - <Debug> - wrong thread: flow has 8, we are 4
7/5/2019 -- 09:49:58 - <Debug> - wrong thread: flow has 8, we are 13
7/5/2019 -- 09:49:58 - <Debug> - wrong thread: flow has 8, we are 15
7/5/2019 -- 09:49:58 - <Debug> - wrong thread: flow has 8, we are 3
7/5/2019 -- 09:49:58 - <Debug> - wrong thread: flow has 8, we are 6
7/5/2019 -- 09:49:58 - <Debug> - wrong thread: flow has 8, we are 14
7/5/2019 -- 09:49:58 - <Debug> - wrong thread: flow has 8, we are 12
7/5/2019 -- 09:49:58 - <Debug> - wrong thread: flow has 8, we are 1
7/5/2019 -- 09:49:58 - <Debug> - wrong thread: flow has 8, we are 9
7/5/2019 -- 09:49:58 - <Debug> - wrong thread: flow has 8, we are 7
7/5/2019 -- 09:49:58 - <Debug> - wrong thread: flow has 8, we are 5
7/5/2019 -- 09:49:58 - <Debug> - wrong thread: flow has 8, we are 2
7/5/2019 -- 09:49:58 - <Debug> - wrong thread: flow has 8, we are 5
7/5/2019 -- 09:49:58 - <Debug> - wrong thread: flow has 8, we are 4
7/5/2019 -- 09:49:58 - <Debug> - wrong thread: flow has 8, we are 5
7/5/2019 -- 09:49:58 - <Debug> - wrong thread: flow has 8, we are 15
7/5/2019 -- 09:49:58 - <Debug> - wrong thread: flow has 8, we are 3
7/5/2019 -- 09:49:58 - <Debug> - wrong thread: flow has 8, we are 15
7/5/2019 -- 09:49:58 - <Debug> - wrong thread: flow has 8, we are 3
7/5/2019 -- 09:49:58 - <Debug> - wrong thread: flow has 12, we are 15
7/5/2019 -- 09:49:58 - <Debug> - wrong thread: flow has 8, we are 14
7/5/2019 -- 09:49:58 - <Debug> - wrong thread: flow has 8, we are 12
7/5/2019 -- 09:49:58 - <Debug> - wrong thread: flow has 8, we are 1
7/5/2019 -- 09:49:58 - <Debug> - wrong thread: flow has 8, we are 9
7/5/2019 -- 09:49:58 - <Debug> - wrong thread: flow has 8, we are 7
7/5/2019 -- 09:49:58 - <Debug> - wrong thread: flow has 8, we are 11
7/5/2019 -- 09:49:58 - <Debug> - wrong thread: flow has 8, we are 2
7/5/2019 -- 09:49:58 - <Debug> - wrong thread: flow has 8, we are 11
7/5/2019 -- 09:49:58 - <Debug> - wrong thread: flow has 8, we are 4
7/5/2019 -- 09:49:58 - <Debug> - wrong thread: flow has 8, we are 11
7/5/2019 -- 09:49:58 - <Debug> - wrong thread: flow has 8, we are 6
7/5/2019 -- 09:49:58 - <Debug> - wrong thread: flow has 8, we are 11
7/5/2019 -- 09:49:58 - <Debug> - wrong thread: flow has 8, we are 15
7/5/2019 -- 09:49:58 - <Debug> - wrong thread: flow has 8, we are 11
What I can tell so far the id is always within the range to 16 (which is the amount of queues/threads we did setup)
[19443] 7/5/2019 -- 10:27:15 - (stream-tcp.c:4687) <Debug> (StreamTcpPacket) -- wrong thread: flow has 10, we are 14
[19443] 7/5/2019 -- 10:27:15 - (stream-tcp.c:4687) <Debug> (StreamTcpPacket) -- wrong thread: flow has 10, we are 14
[19443] 7/5/2019 -- 10:27:15 - (stream-tcp.c:4687) <Debug> (StreamTcpPacket) -- wrong thread: flow has 10, we are 14
[19443] 7/5/2019 -- 10:27:15 - (stream-tcp.c:4687) <Debug> (StreamTcpPacket) -- wrong thread: flow has 10, we are 14
[19443] 7/5/2019 -- 10:27:15 - (stream-tcp.c:4687) <Debug> (StreamTcpPacket) -- wrong thread: flow has 12, we are 14
[19443] 7/5/2019 -- 10:27:15 - (stream-tcp.c:4687) <Debug> (StreamTcpPacket) -- wrong thread: flow has 12, we are 14
[19443] 7/5/2019 -- 10:27:15 - (stream-tcp.c:4687) <Debug> (StreamTcpPacket) -- wrong thread: flow has 12, we are 14
[19443] 7/5/2019 -- 10:27:15 - (stream-tcp.c:4687) <Debug> (StreamTcpPacket) -- wrong thread: flow has 12, we are 14
[19440] 7/5/2019 -- 10:27:15 - (stream-tcp.c:4687) <Debug> (StreamTcpPacket) -- wrong thread: flow has 2, we are 11
[19440] 7/5/2019 -- 10:27:15 - (stream-tcp.c:4687) <Debug> (StreamTcpPacket) -- wrong thread: flow has 2, we are 11
PM Updated by Peter Manev about 7 years ago
Is there anything related to decoder invalids in the stats?
AH Updated by Andreas Herz about 7 years ago
nope:
------------------------------------------------------------------------------------
Date: 5/7/2019 -- 11:00:42 (uptime: 0d, 00h 13m 10s)
------------------------------------------------------------------------------------
Counter                                       | TM Name                   | Value
------------------------------------------------------------------------------------
capture.kernel_packets                        | Total                     | 240402716
capture.kernel_drops                          | Total                     | 123134832
decoder.pkts                                  | Total                     | 117058380
decoder.bytes                                 | Total                     | 87585127020
decoder.ipv4                                  | Total                     | 116624434
decoder.ethernet                              | Total                     | 117058380
decoder.tcp                                   | Total                     | 98124452
decoder.udp                                   | Total                     | 6929596
decoder.icmpv4                                | Total                     | 7068123
decoder.gre                                   | Total                     | 172
decoder.vlan                                  | Total                     | 117058380
decoder.avg_pkt_size                          | Total                     | 748
decoder.max_pkt_size                          | Total                     | 1514
flow.tcp                                      | Total                     | 2337356
flow.udp                                      | Total                     | 187546
flow.icmpv4                                   | Total                     | 13789
defrag.ipv4.fragments                         | Total                     | 5421
defrag.ipv4.reassembled                       | Total                     | 2611
decoder.ipv4.frag_overlap                     | Total                     | 67
tcp.sessions                                  | Total                     | 2210929
tcp.pseudo                                    | Total                     | 13812
tcp.syn                                       | Total                     | 2503758
tcp.synack                                    | Total                     | 1596557
tcp.rst                                       | Total                     | 1137302
tcp.pkt_on_wrong_thread                       | Total                     | 46241013
tcp.stream_depth_reached                      | Total                     | 5207
tcp.reassembly_gap                            | Total                     | 35494
tcp.overlap                                   | Total                     | 14671936
tcp.overlap_diff_data                         | Total                     | 4119
detect.alert                                  | Total                     | 1079050
app_layer.flow.http                           | Total                     | 76092
app_layer.tx.http                             | Total                     | 118715
app_layer.flow.smtp                           | Total                     | 1720
app_layer.tx.smtp                             | Total                     | 1773
app_layer.flow.tls                            | Total                     | 290061
app_layer.flow.ssh                            | Total                     | 48
app_layer.flow.dns_tcp                        | Total                     | 370
app_layer.tx.dns_tcp                          | Total                     | 741
app_layer.flow.ntp                            | Total                     | 2863
app_layer.flow.tftp                           | Total                     | 61
app_layer.flow.failed_tcp                     | Total                     | 3387
app_layer.flow.dns_udp                        | Total                     | 115961
app_layer.tx.dns_udp                          | Total                     | 2116115
app_layer.flow.enip_udp                       | Total                     | 144
app_layer.tx.enip_udp                         | Total                     | 144
app_layer.tx.ntp                              | Total                     | 24621
app_layer.flow.krb5_udp                       | Total                     | 129
app_layer.flow.failed_udp                     | Total                     | 68388
flow_mgr.closed_pruned                        | Total                     | 1141078
flow_mgr.new_pruned                           | Total                     | 1283603
flow_mgr.est_pruned                           | Total                     | 57623
flow_mgr.bypassed_pruned                      | Total                     | 797
flow.spare                                    | Total                     | 20369
flow.tcp_reuse                                | Total                     | 66804
flow_mgr.flows_checked                        | Total                     | 4744
flow_mgr.flows_notimeout                      | Total                     | 4354
flow_mgr.flows_timeout                        | Total                     | 390
flow_mgr.flows_timeout_inuse                  | Total                     | 73
flow_mgr.flows_removed                        | Total                     | 317
flow_mgr.rows_checked                         | Total                     | 65536
flow_mgr.rows_skipped                         | Total                     | 62229
flow_mgr.rows_empty                           | Total                     | 607
flow_mgr.rows_maxlen                          | Total                     | 11
tcp.memuse                                    | Total                     | 473600000
tcp.reassembly_memuse                         | Total                     | 76800000
flow.memuse                                   | Total                     | 25284544
AH Updated by Andreas Herz about 7 years ago
I promised you an update:
- disabling the rollover feature helped reducing the wrong_threads counter
- switching to cluster_qm helped on system with X710 AND X520
- changes in drop rates are not always an improvement, some got better some worse with the changes, we still try to narrow it down and see if other configuration changes help
- the sort of traffic plays a big role, but while gre traffic on one sensor increases the drop rate a lot it didn't on another sensor with same settings. The same applies for vlan, vlaninq, teredo and other types of traffic that are know to be more difficult
PM Updated by Peter Manev about 7 years ago
Thank you for the update! So if i understand it correctly there was part config adjustment that helped with getting the "wrong threads" counter down to 0. In some cases this does or does not directly help with kernel_drops and that is still under investigation. Did i understand correctly ?
AH Updated by Andreas Herz about 7 years ago
The "wrong threads" counter went down to 0 in most but not all cases, in the other cases it is still much better. So still some debugging left to do for us :)
And in some cases the changes helped to reduce kernel_drops but not everywhere.
So the conclusion is, setting cluster_qm and the necessary steps to use it properly (driver update, set_irq_affinity, rss queues) is an improvement in general with the exception of some corner cases.
PM Updated by Peter Manev about 7 years ago
Ok, Then it would mean that the load balancing still needs debugging in some cases even if the config is correct.
Would love to explore that more..
AH Updated by Andreas Herz about 7 years ago
The current test environment looks like this:
We have a T-rex instance running on one machine with the `delay_10_http_browsing_0.pcap` pcap which produces 10Gbit/s traffic (http). We forward this through a gigamon to the test sensor hardware with a DualNIX XL710. We have ~5Gbit/s on each interface enp175s0f0 and enp175s0f1.
As soon as we use more RSS queues we either run into the huge wrong_thread counter (with default rss hash key) or huge drop rates (with the "6D:5A..." key) where huge is somewhere between 30-40%. We could easily reproduce this by changing the RSS hash key from the default one to the "6D:5A.." one and back.
There is no big difference between using 4,6,8,10 queues on each interface and using the assigned cpu cores for those.
When we use just one queue on each interface there is no wrong_thread issue (as expected) and the drop rate goes below 5%, but we see that for each interface one cpu core is at 100%. I tried cluster_flow, cluster_qm, cluster_cpu and even enabled rollover again. The idea is that we still need to do some loadbalancing to other cpu cores which do nothing but without running into the issues with the wrong_thread and drop_rate.
PM Updated by Peter Manev about 7 years ago
Ok - thanks for the update.
What is our Trex start command? (server/client)
When you say increase the queues - how do you mean? If you hvae more than 1 queue you start seeing the problem or if you have 18 RSS queues but 16 threads in cluster_qm mode with AFP?
SC Updated by Sean Cloherty about 7 years ago
Additional info for the table -
I was seeing the same behavior on CentOS 7.6.1810 with Intel X710 and 82599ES NICS running 4.1.4 and using af-packet v3, cluster_flow, 1 queue. I just now noticed that it hasn't been happening on my test hosts since stopped on 3/22 and 5/17 so that is curious.
Also, see CPU cores pinned at 100% while others are idling. It seems to happen to one (sometimes two) core and ONLY to those cores. It is different per box and possibly per Suricata run. I just ran ps -eHO psr --sort=psr to see what was running on those cores. Here is the output for 2 occurrences of 100% utilization on CPU 26 and CPU 28:
156 26 S ? 00:00:00 [migration/26]
157 26 S ? 00:00:00 [ksoftirqd/26]
158 26 S ? 00:00:00 [kworker/26:0]
159 26 S ? 00:00:00 [kworker/26:0H]
160 0 S ? 00:00:00 [rcuob/26]
170 28 S ? 00:00:00 [migration/28]
171 28 S ? 00:00:00 [ksoftirqd/28]
172 28 S ? 00:00:00 [kworker/28:0]
173 28 S ? 00:00:00 [kworker/28:0H]
156 26 S ? 00:00:00 [migration/26]
157 26 S ? 00:00:00 [ksoftirqd/26]
158 26 S ? 00:00:00 [kworker/26:0]
159 26 S ? 00:00:00 [kworker/26:0H]
170 28 S ? 00:00:00 [migration/28]
171 28 S ? 00:00:00 [ksoftirqd/28]
172 28 S ? 00:00:00 [kworker/28:0]
173 28 S ? 00:00:00 [kworker/28:0H]
SC Updated by Sean Cloherty about 7 years ago
- File WRONG_THREAD.ods WRONG_THREAD.ods added
I have stats.log files (5 minute intervals) going back a ways for two test boxes, HOSTB and HOSTM. I determined when the WRONG_THREAD alerts 1st started and when they stopped. With that info I figured out which version of suricata.yaml was running just before the WRONG_THREADS stopped and swapped that back on HOSTM. Using the older suricata.yaml, it took less than 12 hours before WRONG_THREADS appeared (it hadn't done in the week since I last made changes).
Attached is a spreadsheet. The first worksheet has three consecutive stats.log entries. 1st is the last entry before the 1st occurrence of WRONG_THREAD. 2nd is the first entry with WRONG_THREADS. 3rd is the next one following in sequence. On the 2nd worksheet is of the diffs from the two suricata.yaml files. I only included items that were likely to have impact and omitted items like different values in logs that were disabled, etc.
Timeline for the two hosts looks like - - -
HOSTB : Logs going back to June 2017
FIRST OCCURRENCE : Date: 11/15/2018 -- 16:12:52 (uptime: 9d, 00h 25m 17s) from 2018-11-15_stats.zip
tcp.pkt_on_wrong_thread | Total | 378909830
LAST OCCURRENCE : Date: 3/22/2019 -- 16:40:25 (uptime: 1d, 05h 55m 06s) from 2019-03-22_stats.zip
tcp.pkt_on_wrong_thread | Total | 710594620
HOSTM - Logs go back to September 2018
FIRST OCCURRENCE: Date: 1/14/2019 -- 13:27:45 (uptime: 2d, 20h 18m 54s) from 2019-01-14_stats.zip:
tcp.pkt_on_wrong_thread | Total | 1924133244
LAST OCCURRENCE: Date: 5/17/2019 -- 11:23:43 (uptime: 15d, 20h 03m 42s) from 2019-05-17_stats.zip
tcp.pkt_on_wrong_thread | Total | 2407581403
CN Updated by Cooper Nelson about 7 years ago
Hi all, found this while doing a google search for 'tcp.pkt_on_wrong_thread'. I've been doing a deep-dive of our current deployment and this counter is around 25% of total packets, which is troubling.
Unless I'm missing something, this has to either be a problem with suricata's software load-balancer or perhaps just an issue of the counter being broken. I say this based on the observation that I'm using RSS on isolated NUMA nodes to send packets via cluster_flow to worker threads on other NUMA nodes. If cluster_flow was working properly they should all be directed to the same thread, even if RSS is broken. We can see this in the table above, 'cluster_flow' isn't working in any config. Even when using a single queue.
I tried using the ebpf load balancer but that didn't work either. All packets were sent to a single core, per NIC.
Would it be possible to add a flag to log packets that increment a specified counter? Being able to examine the packets triggering this state would be a big help I would think.
CN Updated by Cooper Nelson about 7 years ago
I might know what the problem is. I've been researching 40G NICs for a new build and encountered some interesting discussions of edge cases involving hashing functions, TCP/UDP and IP fragmentation.
When a TCP/UDP packet gets fragmented, only the first packet has the 'original' header in it. This breaks a 5-tuple hashing function, assuming the IP reassembly happens after the hashing, which is the case with suricata. The reassembly is happening within the context of the decode thread, so the subsequent reassembled packets are going to go to a different thread than the first one and incrementing this counter.
The fix I would recommend would be to simplifying the cluster_flow hashing function to the point that it work consistently on all IP traffic. This might have to be just a trivial src->dst hash, as I don't recall exactly how IP fragmentation works.
PM Updated by Peter Manev about 7 years ago
I think i have some suggestions that can significantly lower the "worng_threads" counter. At least in the different set ups i've tried it has provided very positive feedback. Mainly the AFPv3 plus RSS plus cluster_qm set up.
Cooper - what is your set up? I may be mistaken but I think you are running AMD arch right ? Sean - you were on Intel correct?
If you guys like you could share yaml/NIC details (privately) and i can suggest some test conf adjustments to see if any improvement - after which we can update the table and the ticket here. Your help/feedback is much appreciated as always !
CN Updated by Cooper Nelson about 7 years ago
Yes I am on AMD Piledriver for my current deployment. Unfortunately, due to issues with the architecture and our network I have to use the cluster_flow load balancer in order to make use of all of the cores properly. Additionally, I did experiment with the cluster_qm runmode, that did not work either.
Looking over the documentation and source code it does appear that AFPv3 should be defragmenting TCP packets prior to handing them off to the suricata (this is enabled via the 'defrag' config var in the af-packet section).
However what I think is happening is that there is some issue either on the NIC, driver or kernel that is not allowing this to happen properly in all cases. I found a blog post that summarizes the issue:
http://adrianchadd.blogspot.com/2014/08/receive-side-scaling-figuring-out-how.html
The tl;dr is that fragmented TCP packets can end up on different cores in some cases even if you have RSS configured with a symmetric hashing algorithm. So the first TCP fragment would get hashed to core #3 and the rest would get hashed to core #7, for example. The fragmented packets should be getting reassembled properly by AFPv3, however if cluster_flow is using the hash from the NIC it's going to send the reassembled partial packet to a different core. Due to the buffering within AFPv3 (controlled by the block-size), it's very likely that the fragmented TCP packet is going to be processed out of order. I'm also not sure if there is any information within the TCP/IP header that suricata could use to reassemble the two fragments in the correct order, as their headers would be identical I think. They might even get rejected by the stream tracker due to having a bad checksum if you have that feature enabled.
Based on the blog post it looks like Intel handled this for UDP packets by simply hashing on the IPv4 header only. I'll suggest the simplest fix would be to simply provide an option to force 'src->dst' hashing for all IP traffic, specifically for IDS deployments. I would think this should be allowed via ethtool and setting the hashing as 'sd' vs. 'sdfn', however I get an error when I try to do that for TCP. Others have reported this error as well with no solution:
So, if anyone knows how to force hashing on the IP header only for all protocols on the ixgbe driver I would appreciate it if they let me know. Next week I'll look at the driver code and see if its possible to force it there as well.
I originally thought about modifying the cluster_flow hashing algorithm in suricata to ignore the RSS hash and compute its own 'src->dst' hash only, however this will still result in TCP fragments being delivered out-of-order to the worker threads, which might still cause issues. The 'right' way to fix this is to simply force 'sd' hashing for all IP traffic on RSS IDS deployments.
PM Updated by Peter Manev about 7 years ago
Thanks for the feedback Cooper !
Here is what I am staring at:
- I am consistently being able to minimize the (and in the cases of static testing basically to 0) the number of wrong_threads counters on live and/or Trex replay traffic in speeds 20-30Gbps
- On live set ups the wrong_threads counter is basically 0.00some% - still thee but rather negligible (i would still want to know why though)
- This above is only true if I use number of NIC_RSS queues = Number of AFPv3 threads with cluster_qm , on same NUMA running Intel HW.
- I used Trex to test diff pcap combo scenarios (http/https/oracle/dns/udp/tcp/smtp/etc...) in speeds of 30-40Gbps. While I have drops I never hit the wrong_threads counter , never even once. This however is all non frag traffic. As Trex seems is not keen on playing with fragments I then used tcpreplay with a very diverse fragments merged pcap. Is till could not come up with that wrong_threads/pkts counter.
- I need to try more diverse fragmenting pcaps I guess.
- I think it seems this is specific traffic related issue in that case maybe?
- If this is related to fragments - then I think the counters of "wrong_thread" should be somewhat related to the number of frags ? Can you somehow relate that in your set up ?
SC Updated by Sean Cloherty about 7 years ago
Yes, Peter that is correct. Intel CPUs. I'll forward the configs to you ASAP.
AH Updated by Andreas Herz about 7 years ago
I can confirm that with the recommendation by Peter the wrong_thread issue is gone for setups with X710 (i40e) and X5*0 (ixgbe). The counter is either 0 or very very small.
I'm now trying to achieve the same with cards using (igb) and (e1000e), did anyone came up with a solution for those?
While e1000e is really thin on features the igb at least offers the setup of up to 8 queues but no hash key, at least what I can see. So my idea was to reduce it to 1 queue and 1 cluster_qm thread but the issue still occurs. So any hints for those cards/drivers are also welcome.
This is especially present in setups where I have 2 interfaces used. If I go down to 1 interface, 1 queue and 1 thread with igb it's fine but when I use the 2nd interface I see the wrong_thread counter again.
This is what I tried:
ethtool -L enp216s0f0 combined 1
ethtool -L enp216s0f1 combined 1
systemctl stop irqbalance
set_irq_affinity.sh 10 enp216s0f0
set_irq_affinity.sh 11 enp216s0f0
I also enabled cpu affinity and did set the worker:
threading:
  set-cpu-affinity: yes
  cpu-affinity:
    - management-cpu-set:
        cpu: [ 0 ]  # include only these CPUs in affinity settings
    - worker-cpu-set:
        cpu: [ "10-11" ]
        mode: "exclusive"
        prio:
          default: "high"
Interface looks like:
af-packet:
  - interface: enp216s0f0
    threads: 1
    cluster-id: 97
    cluster-type: cluster_qm
    defrag: yes
    rollover: no
    use-mmap: yes
    tpacket-v3: yes
    use-emergency-flush: yes

  - interface: enp216s0f1
    threads: 1
    cluster-id: 96
    cluster-type: cluster_qm
    defrag: yes
    rollover: no
    use-mmap: yes
    tpacket-v3: yes
    use-emergency-flush: yes
Changing back to cluster_flow doesn't help either, only removing one interface helps. Maybe it's not possible to get rid of it on those cards :/
CN Updated by Cooper Nelson about 7 years ago
This is one of those issues that is only going to happen on 'live' traffic traversing bad/broken network hardware that is causing fragmented TCP packets. Test traffic isn't going to have fragmented IP packets (unless you generate them deliberately, I guess).
I'm seeing lots of large http downloads showing as "TRUNCATED", which I think is indicative of a TCP flow starting with small, non-fragmented TCP packets and then later becoming fragmented as the receive window increases. This is the specific case that will break RSS on the older Intel cards, as described in the article.
Andreas, from reading the documentation on the newer Intel 40G cards it appears they have a more robust RSS implementation that allows for fragmented TCP/UDP packets to be properly load-balanced. I think you are correct that older cards are simply 'broken' in this aspect.
However, as I mentioned, if we can force a trivial src->dst (sd) hash for all IP traffic on the NIC, that should fix it. The load-balancing won't be as 'elegant' on the RSS cores, however at least for my deployment that shouldn't matter. Suricata should properly load-balance the threads in software after they are delivered to the dedicated RSS cores and defragmented.
Again, if anyone knows how to force a trivial 'sd' RSS hash for all IP traffic I would appreciate it. As discussed ethtool does not seem to allow it.
SC Updated by Sean Cloherty about 7 years ago
One change to the NIC config which seems to have made a significant difference. I had a different takeaway from this thread and tried enabling csum offloading (ethtool --offload tx on rx on). After 15-16 hours and the result is 1.) No dropped packets 2.) No instances of tcp.pkt_on_wrong_thread or stream.wrong_thread 3.) No instance where one or two worker CPU’s are running at 100% for long periods. These as the only offloading options enabled:
rx-checksumming: on
tx-checksumming: on
tx-checksum-ip-generic: on
tx-checksum-fcoe-crc: on [fixed]
tx-checksum-sctp: on
tx-fcoe-segmentation: on [fixed]
Unlike Andreas’ results, I was seeing the problem but with only 1 active interface on the NUMA node. My only concern is whether or not enabling the offloading of those two functions is either masking the issue, or will have a negative impact on detection. I am using Intel ixgbe drivers v5.5.5 on 82599ES 10-Gigabit NICs.
CN Updated by Cooper Nelson about 7 years ago
Enabling csum offloading seems to have eliminated packet drops.
Still seeing lots of tcp.pkt_on_wrong_thread, though. I did experiment with enabling all offloading, in the hope that maybe something like GRO would reassemble the fragmented TCP packets. This didn't work.
Again, really wish there was some easy way just to force 'sd' hashing on RSS for all IP protocols.
PM Updated by Peter Manev about 7 years ago
Thank you for the updates guys!
One thing that I notice in Seans's set up - it is definitely using 1 RSS combined queue with cluster_flow - so it seems in this case the NIC is not to blame (just 1 queue)
In my set ups - both the tests I run on live traffic and with Trex(which it does not handle/replay vlans and frags) the successful formula so far has been:
Symmetric hashing, number of RSS queues == number of wrokers on same numa node, with cluster_qm and using XDP, AFPv3 (x710 NIC)
I run many dry runs with Trex trying to reproduce things with wrong-thread counters without success until I switch ed to good all tcprewrite/replay and now I have smaller pcap that on the same set up i am able to reproduce a counter increase of wrong_threads on tcpreplay. The pcap contains fragments and special corner vlan and QinQ frag cases where for example one frag has diff vlanid than it should etc,,,, I am trying to narrow it down to just a single small pcap and will update...
It does seem to be related to frags and/or vlans in that case indeed at least from the observations so far.
Will keep you posted of the findings.
SC Updated by Sean Cloherty about 7 years ago
I spoke too soon. After about 16 hours I started seeing drops again on both the test server and the production server getting the same traffic. However, no errors regarding packets / wrong thread. One notable difference - Before enabling the csum offloading, I would see a pattern where Suricata would run for hours or days, then there would be a spike of millions of lost packets in a short (hour or less) timeframe, and then it would stop for a period of time and then repeat. Now packet drops seem to be continuing along for the last 21 hours. I am going to see if I can take the stats and deltas in Splunk and see if there is any correlation between any other stats/deltas and the drops.
PM Updated by Peter Manev about 7 years ago
Sean (if read it correctly) - you can have wrong threads counters in your set up - only if you disable the csum offloading , right? (currently it is enabled , you have some drops but no wrong thread counters )
SC Updated by Sean Cloherty about 7 years ago
That is correct. I enabled the csum offload. In 2+ days there are no wrong threads. However drops are reaching over 5% on traffic that hardly ever exceeds 2G/s. I attached last stats.log output. Should I modify the checksum-checks to yes, auto, no ? And would that have any impact on the checksum-validation setting in streams?
Something else of note. The hosts monitoring general traffic seem to be suffering this issue. I have two hosts which only ingest proxy traffic and they have been 100% fine with no thread errors as far back as I can search.
RN Updated by robson Nascimento about 7 years ago
Hello guys ,
I have checked in my setup, some problems with Balancing and fanout, when I correct the problem of fanout I have problems in balancing. I have a problem also when I make the cpu afinity the one-node of the hardware I use has the colors divided into a non-sequential range.
i using Suricata ips inline mode, and I have verified using the "Cluster_qm" a high number of drops / tcp.reassembly_gap / tcp.pkt_on_wrong_thread
When I disable the "Cluster_qm" and I use cluster_flow with a unique network queue I do not have drops but it happens the same as in the matrix the packages get tied up somewhere that I can not see
Follow my setup
Model name:          Intel(R) Xeon(R) Silver 4114 CPU @ 2.20GHz
L3 cache:            14080K
NUMA node0 CPU(s):   0,2,4,6,8,10,12,14,16,18,20,22,24,26,28,30,32,34,36,38
NUMA node1 CPU(s):   1,3,5,7,9,11,13,15,17,19,21,23,25,27,29,31,33,35,37,39
Interface utilized:
export iface_in="ens1f1"
export iface_out="ens3f1"
Affinity script
~/i40e-2.7.29/scripts/set_irq_affinity -x 6,8,10,12,14,16,18,20,22,24,26,28,30,32,34,36 $iface_in
~/i40e-2.7.29/scripts/set_irq_affinity -x 7,9,11,13,15,17,19,21,23,25,27,29,31,33,35,37 $iface_out
Interface configuration mode:
%YAML 1.1
---
- interface: ens1f1
  copy-iface: ens3f1
  copy-mode: ips
  threads: 16
  use-mmap: yes
  tpacket-v3: yes
  cluster-id: 99
  cluster-type: cluster_qm
  checksum-checks: yes
  defrag: yes
  xdp-mode: driver
  xdp-filter-file: /etc/suricata/ebpf/xdp_filter.bpf
  #ebpf-lb-file:  /etc/suricata/ebpf/lb.bpf
  bypass: yes
  ring-size: 400000
  block-size: 1048576
  mmap-locked: yes
  buffer: 2147483647

- interface: ens3f1
  copy-iface: ens1f1
  copy-mode: ips
  threads: 16
  use-mmap: yes
  tpacket-v3: yes
  cluster-id: 98
  cluster-type: cluster_qm
  checksum-checks: yes
  defrag: yes
  xdp-mode: driver
  xdp-filter-file: /etc/suricata/ebpf/xdp_filter.bpf
  #ebpf-lb-file:  /etc/suricata/ebpf/lb.bpf
  bypass: yes
  ring-size: 400000
  block-size: 1048576
  mmap-locked: yes
  buffer: 2147483647
threading:
  set-cpu-affinity: yes
  # Tune cpu affinity of threads. Each family of threads can be bound
  # on specific CPUs.
  #
  # These 2 apply to the all runmodes:
  # management-cpu-set is used for flow timeout handling, counters
  # worker-cpu-set is used for 'worker' threads
  #
  # Additionally, for autofp these apply:
  # receive-cpu-set is used for capture threads
  # verdict-cpu-set is used for IPS verdict threads
  #
  cpu-affinity:
    - management-cpu-set:
        cpu: [ 2, 3, 4, 5 ]  # include only these CPUs in affinity settings
        #mode: "balanced"
        #prio:
        #  default: "high"
    - worker-cpu-set:
        cpu: [ "6","8","10","12","14","16","18","20","22","24","26","28","30","32","34","36","7","9","11","13","15","17","19","21","23","25","27","29","31","33","35","37" ]
        mode: "exclusive"
        prio:
          low: [ 0 ]
          medium: [ "1" ]
          high: [ "2-37" ]
          default: "high"
Fanout Problem logs, suricata don't respect the afinity configuration:

4204] 30/5/2019 -- 17:21:23 - (util-runmodes.c:297) <Info> (RunModeSetLiveCaptureWorkersForDevice) -- Going to use 16 thread(s)
[4205] 30/5/2019 -- 17:21:23 - (tm-threads.c:1101) <Perf> (TmThreadSetupOptions) -- Setting prio -2 for thread "W#01-ens1f1" to cpu/core 6, thread id 4205
[4206] 30/5/2019 -- 17:21:23 - (tm-threads.c:1101) <Perf> (TmThreadSetupOptions) -- Setting prio -2 for thread "W#02-ens1f1" to cpu/core 7, thread id 4206
[4207] 30/5/2019 -- 17:21:23 - (tm-threads.c:1101) <Perf> (TmThreadSetupOptions) -- Setting prio -2 for thread "W#03-ens1f1" to cpu/core 8, thread id 4207
[4208] 30/5/2019 -- 17:21:23 - (tm-threads.c:1101) <Perf> (TmThreadSetupOptions) -- Setting prio -2 for thread "W#04-ens1f1" to cpu/core 9, thread id 4208
[4209] 30/5/2019 -- 17:21:23 - (tm-threads.c:1101) <Perf> (TmThreadSetupOptions) -- Setting prio -2 for thread "W#05-ens1f1" to cpu/core 10, thread id 4209
[4210] 30/5/2019 -- 17:21:23 - (tm-threads.c:1101) <Perf> (TmThreadSetupOptions) -- Setting prio -2 for thread "W#06-ens1f1" to cpu/core 11, thread id 4210
[4211] 30/5/2019 -- 17:21:23 - (tm-threads.c:1101) <Perf> (TmThreadSetupOptions) -- Setting prio -2 for thread "W#07-ens1f1" to cpu/core 12, thread id 4211
[4212] 30/5/2019 -- 17:21:23 - (tm-threads.c:1101) <Perf> (TmThreadSetupOptions) -- Setting prio -2 for thread "W#08-ens1f1" to cpu/core 13, thread id 4212
[4213] 30/5/2019 -- 17:21:23 - (tm-threads.c:1101) <Perf> (TmThreadSetupOptions) -- Setting prio -2 for thread "W#09-ens1f1" to cpu/core 14, thread id 4213
[4214] 30/5/2019 -- 17:21:23 - (tm-threads.c:1101) <Perf> (TmThreadSetupOptions) -- Setting prio -2 for thread "W#10-ens1f1" to cpu/core 15, thread id 4214
[4215] 30/5/2019 -- 17:21:23 - (tm-threads.c:1101) <Perf> (TmThreadSetupOptions) -- Setting prio -2 for thread "W#11-ens1f1" to cpu/core 16, thread id 4215
[4216] 30/5/2019 -- 17:21:23 - (tm-threads.c:1101) <Perf> (TmThreadSetupOptions) -- Setting prio -2 for thread "W#12-ens1f1" to cpu/core 17, thread id 4216
[4217] 30/5/2019 -- 17:21:23 - (tm-threads.c:1101) <Perf> (TmThreadSetupOptions) -- Setting prio -2 for thread "W#13-ens1f1" to cpu/core 18, thread id 4217
[4218] 30/5/2019 -- 17:21:23 - (tm-threads.c:1101) <Perf> (TmThreadSetupOptions) -- Setting prio -2 for thread "W#14-ens1f1" to cpu/core 19, thread id 4218
[4219] 30/5/2019 -- 17:21:23 - (tm-threads.c:1101) <Perf> (TmThreadSetupOptions) -- Setting prio -2 for thread "W#15-ens1f1" to cpu/core 20, thread id 4219
[4220] 30/5/2019 -- 17:21:23 - (tm-threads.c:1101) <Perf> (TmThreadSetupOptions) -- Setting prio -2 for thread "W#16-ens1f1" to cpu/core 21, thread id 4220

[4204] 30/5/2019 -- 17:21:23 - (util-runmodes.c:297) <Info> (RunModeSetLiveCaptureWorkersForDevice) -- Going to use 16 thread(s)
[4221] 30/5/2019 -- 17:21:23 - (tm-threads.c:1101) <Perf> (TmThreadSetupOptions) -- Setting prio -2 for thread "W#01-ens3f1" to cpu/core 22, thread id 4221
[4222] 30/5/2019 -- 17:21:23 - (tm-threads.c:1101) <Perf> (TmThreadSetupOptions) -- Setting prio -2 for thread "W#02-ens3f1" to cpu/core 23, thread id 4222
[4223] 30/5/2019 -- 17:21:23 - (tm-threads.c:1101) <Perf> (TmThreadSetupOptions) -- Setting prio -2 for thread "W#03-ens3f1" to cpu/core 24, thread id 4223
[4224] 30/5/2019 -- 17:21:23 - (tm-threads.c:1101) <Perf> (TmThreadSetupOptions) -- Setting prio -2 for thread "W#04-ens3f1" to cpu/core 25, thread id 4224
[4225] 30/5/2019 -- 17:21:23 - (tm-threads.c:1101) <Perf> (TmThreadSetupOptions) -- Setting prio -2 for thread "W#05-ens3f1" to cpu/core 26, thread id 4225
[4226] 30/5/2019 -- 17:21:23 - (tm-threads.c:1101) <Perf> (TmThreadSetupOptions) -- Setting prio -2 for thread "W#06-ens3f1" to cpu/core 27, thread id 4226
[4227] 30/5/2019 -- 17:21:23 - (tm-threads.c:1101) <Perf> (TmThreadSetupOptions) -- Setting prio -2 for thread "W#07-ens3f1" to cpu/core 28, thread id 4227
[4228] 30/5/2019 -- 17:21:23 - (tm-threads.c:1101) <Perf> (TmThreadSetupOptions) -- Setting prio -2 for thread "W#08-ens3f1" to cpu/core 29, thread id 4228
[4229] 30/5/2019 -- 17:21:23 - (tm-threads.c:1101) <Perf> (TmThreadSetupOptions) -- Setting prio -2 for thread "W#09-ens3f1" to cpu/core 30, thread id 4229
[4230] 30/5/2019 -- 17:21:23 - (tm-threads.c:1101) <Perf> (TmThreadSetupOptions) -- Setting prio -2 for thread "W#10-ens3f1" to cpu/core 31, thread id 4230
[4231] 30/5/2019 -- 17:21:23 - (tm-threads.c:1101) <Perf> (TmThreadSetupOptions) -- Setting prio -2 for thread "W#11-ens3f1" to cpu/core 32, thread id 4231
[4232] 30/5/2019 -- 17:21:23 - (tm-threads.c:1101) <Perf> (TmThreadSetupOptions) -- Setting prio -2 for thread "W#12-ens3f1" to cpu/core 33, thread id 4232
[4233] 30/5/2019 -- 17:21:23 - (tm-threads.c:1101) <Perf> (TmThreadSetupOptions) -- Setting prio -2 for thread "W#13-ens3f1" to cpu/core 34, thread id 4233
[4234] 30/5/2019 -- 17:21:23 - (tm-threads.c:1101) <Perf> (TmThreadSetupOptions) -- Setting prio -2 for thread "W#14-ens3f1" to cpu/core 35, thread id 4234
[4235] 30/5/2019 -- 17:21:23 - (tm-threads.c:1101) <Perf> (TmThreadSetupOptions) -- Setting prio -2 for thread "W#15-ens3f1" to cpu/core 36, thread id 4235
[4236] 30/5/2019 -- 17:21:23 - (tm-threads.c:1101) <Perf> (TmThreadSetupOptions) -- Setting prio -2 for thread "W#16-ens3f1" to cpu/core 37, thread id 4236
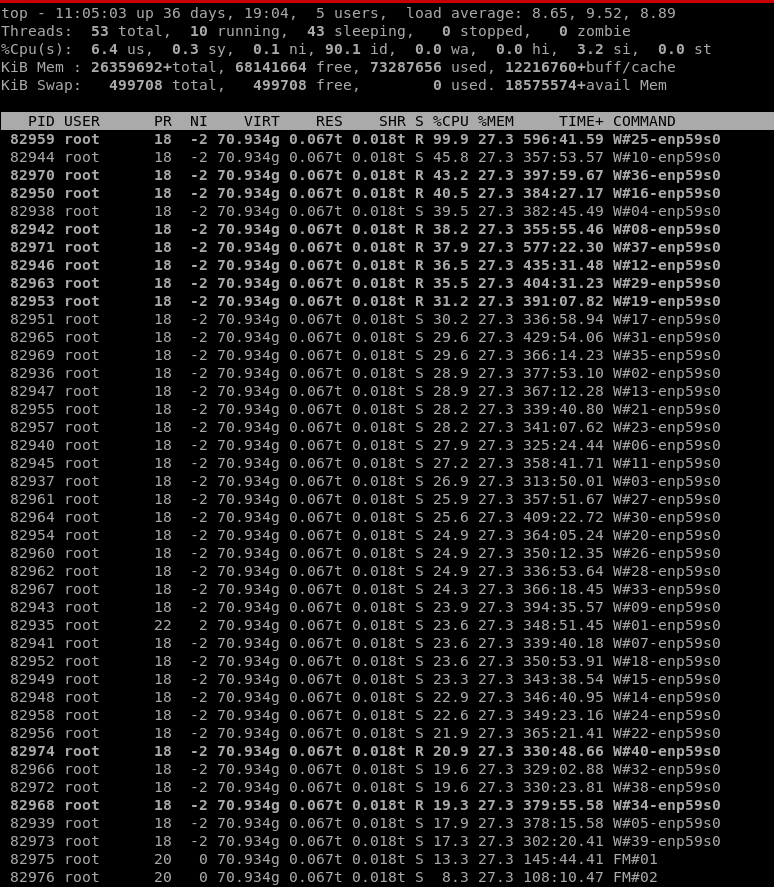
Cluster_QM Load balance Problem, packets don't equal distribuited:
[4205] 30/5/2019 -- 17:23:55 - (source-af-packet.c:2670) <Perf> (ReceiveAFPThreadExitStats) -- (W#01-ens1f1) Kernel: Packets 84948332, dropped 42359227
[4206] 30/5/2019 -- 17:23:56 - (source-af-packet.c:2670) <Perf> (ReceiveAFPThreadExitStats) -- (W#02-ens1f1) Kernel: Packets 0, dropped 0
[4207] 30/5/2019 -- 17:23:56 - (source-af-packet.c:2670) <Perf> (ReceiveAFPThreadExitStats) -- (W#03-ens1f1) Kernel: Packets 0, dropped 0
[4208] 30/5/2019 -- 17:23:56 - (source-af-packet.c:2670) <Perf> (ReceiveAFPThreadExitStats) -- (W#04-ens1f1) Kernel: Packets 0, dropped 0
[4209] 30/5/2019 -- 17:23:56 - (source-af-packet.c:2670) <Perf> (ReceiveAFPThreadExitStats) -- (W#05-ens1f1) Kernel: Packets 0, dropped 0
[4210] 30/5/2019 -- 17:23:56 - (source-af-packet.c:2670) <Perf> (ReceiveAFPThreadExitStats) -- (W#06-ens1f1) Kernel: Packets 18, dropped 0
[4211] 30/5/2019 -- 17:23:56 - (source-af-packet.c:2670) <Perf> (ReceiveAFPThreadExitStats) -- (W#07-ens1f1) Kernel: Packets 14, dropped 0
[4212] 30/5/2019 -- 17:23:56 - (source-af-packet.c:2670) <Perf> (ReceiveAFPThreadExitStats) -- (W#08-ens1f1) Kernel: Packets 32, dropped 0
[4213] 30/5/2019 -- 17:23:56 - (source-af-packet.c:2670) <Perf> (ReceiveAFPThreadExitStats) -- (W#09-ens1f1) Kernel: Packets 13, dropped 0
[4214] 30/5/2019 -- 17:23:56 - (source-af-packet.c:2670) <Perf> (ReceiveAFPThreadExitStats) -- (W#10-ens1f1) Kernel: Packets 47806, dropped 0
[4215] 30/5/2019 -- 17:23:57 - (source-af-packet.c:2670) <Perf> (ReceiveAFPThreadExitStats) -- (W#11-ens1f1) Kernel: Packets 60698, dropped 0
[4216] 30/5/2019 -- 17:23:57 - (source-af-packet.c:2670) <Perf> (ReceiveAFPThreadExitStats) -- (W#12-ens1f1) Kernel: Packets 47625, dropped 0
[4217] 30/5/2019 -- 17:23:57 - (source-af-packet.c:2670) <Perf> (ReceiveAFPThreadExitStats) -- (W#13-ens1f1) Kernel: Packets 110868, dropped 0
[4218] 30/5/2019 -- 17:23:57 - (source-af-packet.c:2670) <Perf> (ReceiveAFPThreadExitStats) -- (W#14-ens1f1) Kernel: Packets 54795, dropped 0
[4219] 30/5/2019 -- 17:23:57 - (source-af-packet.c:2670) <Perf> (ReceiveAFPThreadExitStats) -- (W#15-ens1f1) Kernel: Packets 111116, dropped 0
[4220] 30/5/2019 -- 17:23:57 - (source-af-packet.c:2670) <Perf> (ReceiveAFPThreadExitStats) -- (W#16-ens1f1) Kernel: Packets 139395, dropped 0
[4221] 30/5/2019 -- 17:23:57 - (Source-Af-Packet.C:2670) <Perf> (Receiveafpthreadexitstats) -- (W#01-Ens3f1) Kernel: Packets 69213171, Dropped 25853962
[4222] 30/5/2019 -- 17:23:58 - (source-af-
I have checked in my setup, some problems with Balancing and fanout, when I correct the problem of fanout I have problems in balancing. I have a problem also when I make the cpu afinity the one-node of the hardware I use has the colors divided into a non-sequential range. Follow my setuppacket.c:2670) <Perf> (ReceiveAFPThreadExitStats) -- (W#02-ens3f1) Kernel: Packets 27, dropped 0
[4223] 30/5/2019 -- 17:23:58 - (source-af-packet.c:2670) <Perf> (ReceiveAFPThreadExitStats) -- (W#03-ens3f1) Kernel: Packets 18, dropped 0
[4224] 30/5/2019 -- 17:23:58 - (source-af-packet.c:2670) <Perf> (ReceiveAFPThreadExitStats) -- (W#04-ens3f1) Kernel: Packets 30, dropped 0
[4225] 30/5/2019 -- 17:23:58 - (source-af-packet.c:2670) <Perf> (ReceiveAFPThreadExitStats) -- (W#05-ens3f1) Kernel: Packets 27, dropped 0
[4226] 30/5/2019 -- 17:23:58 - (source-af-packet.c:2670) <Perf> (ReceiveAFPThreadExitStats) -- (W#06-ens3f1) Kernel: Packets 31, dropped 0
[4227] 30/5/2019 -- 17:23:58 - (source-af-packet.c:2670) <Perf> (ReceiveAFPThreadExitStats) -- (W#07-ens3f1) Kernel: Packets 26, dropped 0
[4228] 30/5/2019 -- 17:23:58 - (source-af-packet.c:2670) <Perf> (ReceiveAFPThreadExitStats) -- (W#08-ens3f1) Kernel: Packets 33, dropped 0
[4229] 30/5/2019 -- 17:23:58 - (source-af-packet.c:2670) <Perf> (ReceiveAFPThreadExitStats) -- (W#09-ens3f1) Kernel: Packets 28, dropped 0
[4230] 30/5/2019 -- 17:23:58 - (source-af-packet.c:2670) <Perf> (ReceiveAFPThreadExitStats) -- (W#10-ens3f1) Kernel: Packets 53986, dropped 0
[4231] 30/5/2019 -- 17:23:58 - (source-af-packet.c:2670) <Perf> (ReceiveAFPThreadExitStats) -- (W#11-ens3f1) Kernel: Packets 56785, dropped 0
[4232] 30/5/2019 -- 17:23:58 - (source-af-packet.c:2670) <Perf> (ReceiveAFPThreadExitStats) -- (W#12-ens3f1) Kernel: Packets 89036, dropped 0
[4233] 30/5/2019 -- 17:23:58 - (source-af-packet.c:2670) <Perf> (ReceiveAFPThreadExitStats) -- (W#13-ens3f1) Kernel: Packets 95541, dropped 0
[4234] 30/5/2019 -- 17:23:58 - (source-af-packet.c:2670) <Perf> (ReceiveAFPThreadExitStats) -- (W#14-ens3f1) Kernel: Packets 97854, dropped 0
[4235] 30/5/2019 -- 17:23:58 - (source-af-packet.c:2670) <Perf> (ReceiveAFPThreadExitStats) -- (W#15-ens3f1) Kernel: Packets 116324, dropped 0
[4236] 30/5/2019 -- 17:23:58 - (source-af-packet.c:2670) <Perf> (ReceiveAFPThreadExitStats) -- (W#16-ens3f1) Kernel: Packets 119019, dropped 0
GAP/DROPS running traffig arround "8Gb Out and 4Gb IN"
capture.kernel_drops                          | Total                     | 30851380
tcp.reassembly_gap                            | Total                     | 415
capture.kernel_drops                          | Total                     | 33108671
tcp.reassembly_gap                            | Total                     | 418
capture.kernel_drops                          | Total                     | 36862751
tcp.reassembly_gap                            | Total                     | 437
capture.kernel_drops                          | Total                     | 40214600
tcp.reassembly_gap                            | Total                     | 471
capture.kernel_drops                          | Total                     | 41667557
tcp.reassembly_gap                            | Total                     | 475
capture.kernel_drops                          | Total                     | 41667557
tcp.reassembly_gap                            | Total                     | 475
capture.kernel_drops                          | Total                     | 41667557
tcp.reassembly_gap                            | Total                     | 475
perf stat -C 6,8,10,12,14,16,18,20,22,24,26,28,30,32,34,36,7,9,11,13,15,17,19,21,23,25,27,29,31,33,35,37 -e LLC-loads,LLC-load-misses,LLC-stores,LLC-store-misses,LLC-prefetch-misses -I500

   472.873703526    <not supported>      LLC-prefetch-misses
   473.374174031          8,791,280      LLC-loads                                                     (50.00%)
   473.374174031          5,271,962      LLC-load-misses           #  323.35% of all LL-cache hits     (50.00%)
   473.374174031          3,567,877      LLC-stores                                                    (50.00%)
   473.374174031          1,728,600      LLC-store-misses                                              (50.00%)
CN Updated by Cooper Nelson about 7 years ago
Sean Cloherty wrote:
Something else of note. The hosts monitoring general traffic seem to be suffering this issue. I have two hosts which only ingest proxy traffic and they have been 100% fine with no thread errors as far back as I can search.
This is another datapoint in favor of my theory is that what we are seeing is an artifact of TCP packets fragmented mid-session on general "dirty" internet traffic.
In the interest of full disclosure, its been pointed out to me that TCP window scaling shouldn't cause this directly, as the IP packets are still going to be 1514 bytes. However, I'm off the opinion that the higher data rates associated with IT might cause the effect on marginal connections/hardware.
AH Updated by Andreas Herz about 7 years ago
@robson do you also see wrong_threads or just drops? what version of suricata? and could you test out ids mode instead of ips for comparison?
@all should we start a shared gdoc sheet to gather our findings and setups (hardware, nic, config)?
RN Updated by robson Nascimento about 7 years ago
@ Andreas Herz
I see wrong_threads and drops, but I'm finding it wrong because it's wrong where the affinity of threads is defined, if looking at the logs the suricata is starting the wrong sequence, same thing the part of balancing when using workers with cluster_qm, it does not do the balancing always gets stuck only to a queue (Look traffic statistics by threads). I'm using version 4.0 dev, but as a test however I've already used versions 4.1.2, 4.1.4 and 5.0 (dev). I'm using "5.1.3" kernel, but I've already used the "4.14 / 4.15 / 4.19" versions, but in both the behavior is similar.
I already tested in IDS mode but I did not identify differences.
Suricata afinity
threading:
  set-cpu-affinity: yes
  # Tune cpu affinity of threads. Each family of threads can be bound
  # on specific CPUs.
  #
  # These 2 apply to the all runmodes:
  # management-cpu-set is used for flow timeout handling, counters
  # worker-cpu-set is used for 'worker' threads
  #
  # Additionally, for autofp these apply:
  # receive-cpu-set is used for capture threads
  # verdict-cpu-set is used for IPS verdict threads
  #
  cpu-affinity:
    - management-cpu-set:
        cpu: [ 2, 3, 4, 5 ]  # include only these CPUs in affinity settings
        #mode: "balanced"
        #prio:
        #  default: "high"
    - worker-cpu-set:
        cpu: [ "6","8","10","12","14","16","18","20","22","24","26","28","30","32","34","36","7","9","11","13","15","17","19","21","23","25","27","29","31","33","35","37" ]
        mode: "exclusive"
        prio:
          low: [ 0 ]
          medium: [ "1" ]
          high: [ "2-37" ]
          default: "high"
Interface configuration:
Interface configuration mode:
%YAML 1.1
---
- interface: ens1f1
  copy-iface: ens3f1
  copy-mode: ips
  threads: 16
  use-mmap: yes
  tpacket-v3: yes
  cluster-id: 99
  cluster-type: cluster_qm
  checksum-checks: yes
  defrag: yes
  xdp-mode: driver
  xdp-filter-file: /etc/suricata/ebpf/xdp_filter.bpf
  #ebpf-lb-file:  /etc/suricata/ebpf/lb.bpf
  bypass: yes
  ring-size: 400000
  block-size: 1048576
  mmap-locked: yes
  buffer: 2147483647

- interface: ens3f1
  copy-iface: ens1f1
  copy-mode: ips
  threads: 16
  use-mmap: yes
  tpacket-v3: yes
  cluster-id: 98
  cluster-type: cluster_qm
  checksum-checks: yes
  defrag: yes
  xdp-mode: driver
  xdp-filter-file: /etc/suricata/ebpf/xdp_filter.bpf
  #ebpf-lb-file:  /etc/suricata/ebpf/lb.bpf
  bypass: yes
  ring-size: 400000
  block-size: 1048576
  mmap-locked: yes
  buffer: 2147483647
Intel X710 Driver/firmeware version
driver: i40e
version: 2.1.14-k
firmware-version: 6.80 0x80003d72 18.8.9
expansion-rom-version:
bus-info: 0000:05:00.1
supports-statistics: yes
supports-test: yes
supports-eeprom-access: yes
supports-register-dump: yes
supports-priv-flags: yes
CN Updated by Cooper Nelson about 7 years ago
@ Robson Nascimento
I see you are using one of the newer i40e NICs.
Could you try using ethtool to set a 'sd' hash for TCP and see if that addresses the tcp packets on the wrong thread?
/usr/sbin/ethtool -N ens1f1 rx-flow-hash tcp4 sd
/usr/sbin/ethtool -N ens1f1 rx-flow-hash tcp6 sd
This doesn't work on the ixgbe driver, not sure if its a hardware or software issue.
PM Updated by Peter Manev about 7 years ago
@ robson Nascimento
This is not a Suricata issue - this is bound to kernel version in my opinion - at least from what i have seen.
On 4.18+ and 4.14 when using xdp and affinity in corner cases like yours you need to rerun
~/i40e-2.7.29/scripts/set_irq_affinity -x 6,8,10,12,14,16,18,20,22,24,26,28,30,32,34,36 $iface_in
~/i40e-2.7.29/scripts/set_irq_affinity -x 7,9,11,13,15,17,19,21,23,25,27,29,31,33,35,37 $iface_out
right after Suricata starts. Its only those two versions i've seen doing that with Intel and XDP. I am tracking that and will updated if really it is related to the kernel.
(this is at least my observation with this NIC driver version combo)
Also I see you re running IPS mode with AFPv3 which is not recommended.
RN Updated by robson Nascimento about 7 years ago
@Peter
If you want, I can provide a LAB environment with mirrored traffic with the gigamon bordering around 20GB.
I tested the latest firmware / driver available for these intel x710. I have already tested native versions of the kernel but without significant change.
AH Updated by Andreas Herz about 7 years ago
So some updates from my side. I have two systems that are receiving around 8gbit/s split over two interfaces. We use t-rex (/t-rex-64 -f cap2/http_simple.yaml -c 8 -m 10000 -d 10000) to generate the traffic.
One system is X710 with i40e and one system is X520 with ixgbe drivers. As soon as I enable sym. hashing and 10/8 queues per interface I can confirm that the wrong_threads counter is 0. This even works with cluster_flow besides cluster_qm. I can also confirm, based on the per thread stats.log that the distribution between the 20/16 (2*10/2*8 queues) threads is very well done, same for the dedicated load on the cpu cores. I also disabled rollover in the interface section.
So IMHO that is what we want to have as a baseline, all cores busy with similiar amounts of traffic.
BUT the drops are still a big but also strange issue, because when I restart suricata that jump up to 65% and decline step by step. But even when I look into the delta between two stats.log outputs (20seconds) I still see 5-10% drop rate.
The huge spike at the beginning lasts for around 3 minutes before it starts declining.
When the threads and cores aren't aligned to the queues the wrong_thread counter comes back again, which is no real surprise, but the drop rate is low.
The increase of the wrong_thread counter correlates with the smaller increase in the droprates in comparison to the modes above (threads aligned to queues). So this might be an explanation that packets "lost" due to the wrong_threads won't be counted for the drops.
So while I recommend to achieve the no wrong_thread counter state, try to compare droprates between those scenarios if you also see an increase.
EDIT: I forgot to mention that there is also a huge improvement with regards to the drop counter on the NIC itself. Before the queue changes the drop counter on the NIC was also quite high, thus it is quite obvious that the drop counter on suricata might be lower since a lot of traffic doesn't event reach it.
On the other hand runs with t-rex-64 -f cap2/sfr3.yaml -c 8 -m 100 -d 100000 can achieve 10GBit/s without drops (only some minor peaks which result in 0.05% droprate)
PM Updated by Peter Manev about 7 years ago
Since Trex does not handle/replay vlan and fragments (at last in my observations) - i think we can conclude it is vlan/QinQ/fragments related most likely - with respect to the "wrong_thread" counter. I have case that i can consistently reproduce by using tcpreplay - reproduce "wrong_thread" counter. I have been trying to narrow it down to specific flow.
CN Updated by Cooper Nelson about 7 years ago
Indeed, it is very important to test with 'organic' IP traffic from the "Dirty Internet". LAN and test boxes won't show this effect unless you explicitly engineer it.
CN Updated by Cooper Nelson about 7 years ago
Found this in the ixgbe sources, looks like it is a hardware limitation for TCP on these cards
static int ixgbe_set_rss_hash_opt(struct ixgbe_adapter *adapter,
struct ethtool_rxnfc *nfc)
{
u32 flags2 = adapter->flags2;
/*
 * RSS does not support anything other than hashing
 * to queues on src and dst IPs and ports
         */
CN Updated by Cooper Nelson about 7 years ago
I have possibly made some progress here.
I was experimenting with the older run modes, the tcp.pkt_on_wrong_thread counter isn't present when using either pcap or af_packet and the 'autofp' runmode. However packet drops are through the roof.
What I think is happening here is that by putting the stream tracker on the RSS cores, fragmented TCP packets are properly reassembled by suricata before being sent to the detect threads. In the 'workers' runmode, fragmented TCP packets end up on different worker threads which breaks the stream tracker.
Not sure how to fix this as you really need to use the 'workers' runmode on a busy sensor. For small deployments autofp will be a practical solution.
VJ Updated by Victor Julien about 7 years ago
- Related to Feature #3011: Add new 'cluster_peer' runmode to allow for load balancing by IP header (src<->dst) only added
RN Updated by robson Nascimento about 7 years ago
@Cooper Nelson
his doesn't work on the i40e driver, not sure if its a hardware or software issue
AH Updated by Andreas Herz about 7 years ago
I did more testing with Intel I350 Gigabit cards (igb driver). I can get rid of the wrong_thread counter when I use just one combined queue and disable rollover in the interface section. BUT this only works as long as I just use one interface, as soon as I use a second interface with the same settings the counter increases again. I even forced 1 thread per interface (as it's not much traffic ~200mbit/s average) so I don't see any performance issues. But even though I did set irq affinity and cpu affinity there is still a wrong thread_counter at around 10% of received packets.
So far I'm out of ideas how to fix it with igb based cards, they don't support the rss hash key setting. So at least for those cases I think it might be worth to discuss options that AF_PACKET could provide. @Eric Leblond do you have any ideas what we could do with cards like those?
With e1000e cards it's not the same, as soon as I disable rollover the wrong_thread counter is gone or really low (with counter_flow). So it's something to work on the igb side I guess.
AH Updated by Andreas Herz about 7 years ago
As pointed out in the other issue #2900 it can be fixed by using autofp instead of workers which is not perfect but should be enough for 1gbit/s.
I can confirm that for e1000e and igb setups, even those with several interfaces, can anyone else confirm this as well?
CN Updated by Cooper Nelson about 7 years ago
Andreas Herz wrote:
So far I'm out of ideas how to fix it with igb based cards, they don't support the rss hash key setting. So at least for those cases I think it might be worth to discuss options that AF_PACKET could provide. @Eric Leblond do you have any ideas what we could do with cards like those?
AF_PACKET is supposed to handle this case per the man pages:
IP fragmentation causes packets from the same flow to have different flow
              hashes.  The flag PACKET_FANOUT_FLAG_DEFRAG, if set, causes
              packets to be defragmented before fanout is applied, to pre‐
              serve order even in this case.
http://man7.org/linux/man-pages/man7/packet.7.html
I presume this is what the 'defrag' option in the af-packet section of the .yaml controls. This could be broken or dependent on some hardware or driver features.
PM Updated by Peter Manev about 7 years ago
I have a reproducible test with a pcap using tcpreplay that I have requested for Andreas to confirm on his set up - basically i40/symmetric hashing/cluster_qm resulting in
stream.wrong_thread                           | Total                     | 4
tcp.pkt_on_wrong_thread                       | Total                     | 8
and none of those counters above when using autofp. If he confirms - then we actually may have something to 0 in on - i can share the pcap too (just need confirmation)
 Updated by Anonymous about 7 years ago
FreeBSD 11.2
netmap
Intel pro/1000 PT (em driver)
Can confirm that using autofp instead of workers run mode fixes the issue.
PM Updated by Peter Manev about 7 years ago
good info - at this point it seems it is not af_packet/netmap related as well.
PM Updated by Peter Manev about 7 years ago
I can narrow it down with a specific pcap in my set up to the following
- afpv3, 1 RSS , and cluster_flow with 36 threads- no wrong_thread counters while doing one time tcpreplay of the pcap
- afpv3, 36 RSS , and cluster_qm with 36 threads, symmetric hashing - i have 4 wrong_thread counters while doing one time tcpreplay of the pcap
- no wrong_thread counter while using autofp as well.
The pcap has lots of frga/vlan/qinq cases.
CN Updated by Cooper Nelson about 7 years ago
@Peter Manev,
Maybe a tall order, but could you try identifying all TCP flows with at least one fragmented packet and put them in seperate file for testing?
If my hypothesis is correct you should get the same number (4) of wrong thread counters. Then you can check to see if can find TCP flows which contain a mix of fragmented and unfragmented packets and focus on those?
Based on your observation, the problem is an interaction between RSS on the NIC and afpv3, which is putting TCP packets from the same flow in different queues. If it doesn't happen with 1 queue and cluster_flow, then the problem isn't with suri.
I think if I remember correctly regit mentioned that cluster_flow will use the RSS hash from the NIC to compute its own hash if present, which means using multi-queue RSS and cluster_flow will result in the same problem.
PM Updated by Peter Manev about 7 years ago
- File issue-2725.tar.xz issue-2725.tar.xz added
Here is counter corner case if you will. The difference is that i can actually reproduce this at will.
Attached as well (in the archive) we have full details for each run plus inventory set up plus (nasty) pcap to reproduce the results below. Also in the details attached are alerts/packets that triggered the "SURICATA STREAM pkt seen on wrong thread" alerts/counters
So here is the breakdown and sum up of multitude of runs of the tests:
| # | Issue Appears | OS/Distribution | Kernel Version | NIC/driver/version | runmode | Queues/threads/workers | Notes |
|---|---|---|---|---|---|---|---|
| 1 | NO | Ubuntu Bionic | 4.18.0-20-generic | XL710 for 40GbE QSFP+,i40, 2.7.29 | AFP v3, cluster_flow | 4RSS, 4 Workers | With Rust, Toeplitz hash function, low entropy key. Offloading off, ntuple-filters: on, receive-hashing: on, "af-packet.0.defrag = yes" and "af-packet.1.defrag = yes" |
| 2 | YES | Ubuntu Bionic | 4.18.0-20-generic | XL710 for 40GbE QSFP+,i40, 2.7.29 | AFP v3, cluster_qm | 4RSS, 4 Workers | With Rust, Toeplitz hash function, low entropy key. Offloading off, ntuple-filters: on, receive-hashing: on, "af-packet.0.defrag = yes" and "af-packet.1.defrag = yes" |
| 3 | YES | Ubuntu Bionic | 4.18.0-20-generic | XL710 for 40GbE QSFP+,i40, 2.7.29 | AFP v3, cluster_qm | 36 RSS, 36 Workers | With Rust, Toeplitz hash function, low entropy key. Offloading off, ntuple-filters: on, receive-hashing: on, "af-packet.0.defrag = yes" and "af-packet.1.defrag = yes" |
| 4 | YES | Ubuntu Bionic | 4.18.0-20-generic | XL710 for 40GbE QSFP+,i40, 2.7.29 | AFP v3, cluster_qm | 36 RSS, 36 Workers | With Rust, Toeplitz hash function, low entropy key. Offloading off, ntuple-filters: on, receive-hashing: on, "af-packet.0.defrag = no" and "af-packet.1.defrag = no" |
| # | Issue Appears | stream.wrong_thread / tcp.pkt_on_wrong_thread | Notes |
|---|---|---|---|
| 1 | NO | 0 / 0 | |
| 2 | YES | 2 / 4 | |
| 3 | YES | 4 / 8 | x2 on the counters from test 2 |
| 4 | YES | 4 / 8 | x2 on the counters from test 2 |
If I use the same setup as described in the attached details and above in the tables - but with Trex and do a run like so:
./t-rex-64 -f cap2/sfr_agg_tcp14_udp11_http200msec_new_high_new_nir_profile_ipg_mix.yaml -c 8 -m 22 -d 10000
I have NO "wrong" counters in any cluster_qm set up. The only "wrong" counters appear with cluster_flow (the reverse of above). The difference between the two test processes (trex and tcpreplay pcap) is that the pcap contains purposefully out of fragments with vlans and the trex run has none of those.
I am open to feedback/reproducible runs info/thoughts etc...
NOTE: Just for info - I have NO stream.wrong_thread / tcp.pkt_on_wrong_thread counters with autofp runmode or reading the pcap with autofp.
CN Updated by Cooper Nelson about 7 years ago
Peter Manev wrote:
I am open to feedback/reproducible runs info/thoughts etc...
I think the Issue Appears "NO" for the first case is a false-negative caused by the low number of worker threads. Remember cluster_flow isn't using a proper toeplitz hash, rather its using a adding function (per regit) for the sdfn five-tuple. This is much less 'random' than the toeplitz function, so packets with similar headers (fragments) are much more likely to end up in the same queue when there are a low number of worker threads. Since there isn't a TCP header on the second IP fragment, cluster_flow is probably going to just use '0' for 'fn' of its 'sdfn' hash; while 'sd' will be the same. So the packet will be sent to 'close' worker, rather than a random one. This will hide the issue with a low number of worker threads; if you did a test with 36 workers you would probably see the issue.
From my understanding of the RSS toeplitz implementation, zeroing out the 'fn' fields will send the packet to a 'random' thread (as its a 'proper' hash); though there is still a 25% chance it will end up in the right queue given the low number of worker threads.
I'm using 48 worker threads so this is still a problem in my deployment.
Basically what I'm asking for is either a new cluster mode (cluster_peer) that is even less random than the current implementation, or maybe having a new section in the yaml to config the cluster_flow loadbalancer. I.e., sd vs. sdfn.
I think its important to understand that this is simultaneously a software, hardware, TCP/IP and (physical) networking problem.
CN Updated by Cooper Nelson about 7 years ago
Addenda: You really should have 'Queues/threads/workers' set to a high number and the same for test cases.
CN Updated by Cooper Nelson about 7 years ago
@Peter Manev
At this point I'm very close to 100% sure I know what 'generic' problem is, meaning what is happening in all the cases described here. It's possible there are other related edged cases, but I'm certain what we are seeing on our sensors is the same thing.
The most important thing to realize is that the source of the problem is in the RSS implementation on your NICs, which is 'baked' into the ROM on the firmware and can't be fixed (as far as I know). I'll break the problem down in pieces and show why you are seeing what appears to be odd results in your experiment.
It's critical to understand first what happens when a TCP/IP packet gets fragmented. Only the first packet will have the TCP header, subsequent fragments have the IP header only (along with an offset). Of course, this will break RSS implementations that are using 'sdfn' hashing, sending the fragments to different RSS queues. This is undesired behavior.
They way RSS handles this case is to check to see if the 'fragflag' is set on each TCP packet; if it is RSS reverts to 'sd' hashing only. So the the first fragment and all subsequent fragments are hashed on the IP header only, sending them all to the same RSS queue. The problem we are seeing is simply due to TCP flows that have a mix of fragmented and unfragmented packets. As I've mentioned, its very common for flows to begin without fragmentation and it only happens later as the receive window increases. So the fragmented TCP packets are sent to a different RSS queue, where AF_PACKET reassembles them. They are however now in the 'wrong' thread, which is why the counter increments.
In your specific case, lets use an example. Say there are two large TCP flows (1,000+ packets), each containing four fragmented TCP packets. This would result in test cases 3 and 4, given the large number of RSS/worker threads. There is only a 1 in 36 chance that the fragmented packets would be sent to the same thread as the unfragmented packets, resulting in a total of 8 tcp.pkt_on_wrong_thread.
In cases 1 and 2, given there are only 4 RSS queues/threads, there is a 1 in 4 chance the packets will end up on the same queue, assuming a purely 'random' hashing implementation, like Toeplitz. So its not really surprising that we would see lower numbers with lower thread counts in general. I think the first case is 0 simply because cluster_flow doesn't use a true 'random' hash and will often direct packets to same queue if the port numbers are missing and the thread count is low.
Given that this is "feature", not a bug, of the RSS implementation, it will need to be fixed either in the linux kernel or suricata itself. In the kernel, AF_PACKET could be modified to compute a proper Toeplitz hash after TCP packets are defragmented and then send the packet to the 'correct' RSS queue. Or, suricata could be modified to hash only on IPv4 headers, or possibly check the fragflag if its still set after reassembly, computing a new Toeplitz hash and then copying the packet to the proper worker thread.
This issue doesn't happen in auto_fp mode simply because there is only one stream tracker which processes all TCP packets, regardless of whether or not they were fragmented. In the 'worker' runmode each thread has its own stream tracker.
PM Updated by Peter Manev about 7 years ago
So - the analysis/feedback help! But they take me for a wild ride in terms of confirming and doing consecutive reproducible runs. (esp on diff NICs which it should not matter actually)
I have started a sequence and will report back.
CN Updated by Cooper Nelson about 7 years ago
@Peter Manev,
I'll suggest standardizing on a high number of RSS/worker threads.
The 'bug' is in the RSS implementation itself, which I believe is standardized across all NICs as its a published spec:
https://docs.microsoft.com/en-us/windows-hardware/drivers/network/rss-hashing-types
"If a NIC receives a packet that has both IP and TCP headers, NDIS_HASH_TCP_IPV4 should not always be used. In the case of a fragmented IP packet, NDIS_HASH_IPV4 must be used. This includes the first fragment which contains both IP and TCP headers."
There's your problem! RSS breaks for TCP flows with a mix of non-fragmented and fragmented packets, with fragmented packets hashed against the IPV4 header only.
If the NICs allow you to force 'sd' hashing for all protocols that should fix the issue; Intel cards do not seem to allow this.
You are going to find this problem on every NIC that implements the published RSS spec. And if they don't follow the spec they are going to be broken anyway, as the fragments themselves will go to different RSS queues.
PM Updated by Peter Manev about 7 years ago
It seems there is just an easier way to force/try/test LB on per IP pairs only.
the set up that i have used after multiple different combinations - i am sure the type of "dirty" traffic exists (vlans/frags/out of order/GREs) to be able to trigger even minimal numbers of "wrong_threads"
This is what I have done.
On an Intel set up - with latest Suricata master (rev fa0008dbb)
you can force on the NIC only IP based load balancing and then set up the same number of queues on the NIC with the same number of worker threads.
In my case 40 RSS with low entropy for symmetric hashing / 40 workers (cluster_qm/afpv3/xdp)
The results so far are pretty impressive (again this is for the moment - i need to let it run at least fro 24-48hrs to be convinced)
Older set up results in small number of "wrong_thread" the "newer" config results on 0 "wrong_thread" (at least so far, 1 hr)
The only diff between the older and newer config is
for proto in tcp4 udp4 tcp6 udp6; do
       echo "/usr/local/sbin/ethtool -N enp59s0 rx-flow-hash $proto sdfn"
       /usr/local/sbin/ethtool -N enp59s0 rx-flow-hash $proto sd
done
Versus
for proto in tcp4 udp4 tcp6 udp6; do
       echo "/usr/local/sbin/ethtool -N enp59s0 rx-flow-hash $proto sd"
       /usr/local/sbin/ethtool -N enp59s0 rx-flow-hash $proto sd
done
so only IP balancing
/usr/local/sbin/ethtool -N enp59s0 rx-flow-hash $proto sdfn
vs ("new" config)
/usr/local/sbin/ethtool -N enp59s0 rx-flow-hash $proto sd
Here is the exact (new ) config:
rmmod i40e && modprobe i40e
ifconfig enp59s0 down
/usr/local/sbin/ethtool -L enp59s0 combined 40
/usr/local/sbin/ethtool -K enp59s0 rxhash on
/usr/local/sbin/ethtool -K enp59s0 ntuple on
ifconfig enp59s0 up
/opt/i40e/i40e-2.7.12/scripts/set_irq_affinity local enp59s0
/usr/local/sbin/ethtool -X enp59s0 hkey 6D:5A:6D:5A:6D:5A:6D:5A:6D:5A:6D:5A:6D:5A:6D:5A:6D:5A:6D:5A:6D:5A:6D:5A:6D:5A:6D:5A:6D:5A:6D:5A:6D:5A:6D:5A:6D:5A:6D:5A:6D:5A:6D:5A:6D:5A:6D:5A:6D:5A:6D:5A equal 40

/usr/local/sbin/ethtool -A enp59s0 rx off tx off
/usr/local/sbin/ethtool -C enp59s0 adaptive-rx off adaptive-tx off rx-usecs 125
/usr/local/sbin/ethtool -G enp59s0 rx 1024
ip link set enp59s0 promisc on arp off up
echo 1 > /proc/sys/net/ipv6/conf/enp59s0/disable_ipv6

/usr/local/sbin/ethtool -x enp59s0
/usr/local/sbin/ethtool -n enp59s0

for i in rx tx tso ufo gso gro lro tx nocache copy sg txvlan rxvlan; do
       echo " /usr/local/sbin/ethtool -K enp59s0 $i off 2>&1 > /dev/null; "
       /usr/local/sbin/ethtool -K enp59s0 $i off 2>&1 > /dev/null;
done

for proto in tcp4 udp4 tcp6 udp6; do
       echo "/usr/local/sbin/ethtool -N enp59s0 rx-flow-hash $proto sd"
       /usr/local/sbin/ethtool -N enp59s0 rx-flow-hash $proto sd
done
Older set up:
tail -F /var/log/suricata/stats.log  |grep -E "wrong_thread"
stream.wrong_thread                           | Total                     | 3623
tcp.pkt_on_wrong_thread                       | Total                     | 129981
stream.wrong_thread                           | Total                     | 3625
tcp.pkt_on_wrong_thread                       | Total                     | 130005
stream.wrong_thread                           | Total                     | 3632
tcp.pkt_on_wrong_thread                       | Total                     | 130173
stream.wrong_thread                           | Total                     | 3636
tcp.pkt_on_wrong_thread                       | Total                     | 130215
stream.wrong_thread                           | Total                     | 3636
tcp.pkt_on_wrong_thread                       | Total                     | 130216
stream.wrong_thread                           | Total                     | 3638
tcp.pkt_on_wrong_thread                       | Total                     | 130271
stream.wrong_thread                           | Total                     | 3640
tcp.pkt_on_wrong_thread                       | Total                     | 130283
stream.wrong_thread                           | Total                     | 3643
tcp.pkt_on_wrong_thread                       | Total                     | 130310
stream.wrong_thread                           | Total                     | 3644
tcp.pkt_on_wrong_thread                       | Total                     | 130337
stream.wrong_thread                           | Total                     | 3648
tcp.pkt_on_wrong_thread                       | Total                     | 130345
New config (no wrong_threads counters ):
root@suricata:/var/log/suricata# tail -F /var/log/suricata/stats.log  |grep -E "kernel|wrong_thread|memcap|drop"
capture.kernel_packets                        | Total                     | 269889736
capture.kernel_packets                        | Total                     | 309766698
capture.kernel_packets                        | Total                     | 349928554
capture.kernel_packets                        | Total                     | 390177210
capture.kernel_packets                        | Total                     | 435593455
capture.kernel_packets                        | Total                     | 479815997
capture.kernel_packets                        | Total                     | 528192507
capture.kernel_packets                        | Total                     | 572441999
capture.kernel_packets                        | Total                     | 615147834
capture.kernel_packets                        | Total                     | 659455671
capture.kernel_packets                        | Total                     | 702674897
capture.kernel_packets                        | Total                     | 745687505
capture.kernel_drops                          | Total                     | 22893
capture.kernel_packets                        | Total                     | 786052325
capture.kernel_drops                          | Total                     | 22893
capture.kernel_packets                        | Total                     | 831681296
capture.kernel_drops                          | Total                     | 22893
capture.kernel_packets                        | Total                     | 874643370
capture.kernel_drops                          | Total                     | 22893
capture.kernel_packets                        | Total                     | 918038369
capture.kernel_drops                          | Total                     | 22893
capture.kernel_packets                        | Total                     | 959010389
capture.kernel_drops                          | Total                     | 22893
capture.kernel_packets                        | Total                     | 1002183296
capture.kernel_drops                          | Total                     | 22893
capture.kernel_packets                        | Total                     | 1044549822
capture.kernel_drops                          | Total                     | 22893
capture.kernel_packets                        | Total                     | 1089673678
capture.kernel_drops                          | Total                     | 22893
capture.kernel_packets                        | Total                     | 1132199735
capture.kernel_drops                          | Total                     | 22893
capture.kernel_packets                        | Total                     | 1172231089
capture.kernel_drops                          | Total                     | 22893
capture.kernel_packets                        | Total                     | 1211256030
capture.kernel_drops                          | Total                     | 22893
I was talking to Eric this morning about that as well.
It seems there could also be another way - using XDP_CPU redirect with 1 RSS queue
( https://github.com/regit/suricata/commits/ebpf-xdp-update-5.0-v1 )
PM Updated by Peter Manev about 7 years ago
Close to 48hrs in - I still have 0 "wrong_thread" counters. That I have not seen anywhere else before.
tail -F /var/log/suricata/stats.log  |grep -E "kernel|wrong_thread|memcap|drop"
capture.kernel_drops                          | Total                     | 5593901652
capture.kernel_packets                        | Total                     | 190532961464
capture.kernel_drops                          | Total                     | 5595254612
capture.kernel_packets                        | Total                     | 190571331945
capture.kernel_drops                          | Total                     | 5596392627
capture.kernel_packets                        | Total                     | 190614600384
capture.kernel_drops                          | Total                     | 5598593450
capture.kernel_packets                        | Total                     | 190655044977
capture.kernel_drops                          | Total                     | 5599574563
capture.kernel_packets                        | Total                     | 190694846049
capture.kernel_drops                          | Total                     | 5600963053
capture.kernel_packets                        | Total                     | 190726467405
capture.kernel_drops                          | Total                     | 5601867425
capture.kernel_packets                        | Total                     | 190755744953
capture.kernel_drops                          | Total                     | 5603018343
capture.kernel_packets                        | Total                     | 190787081188
capture.kernel_drops                          | Total                     | 5603706080
capture.kernel_packets                        | Total                     | 190822401883
capture.kernel_drops                          | Total                     | 5604930834
capture.kernel_packets                        | Total                     | 190853232777
capture.kernel_drops                          | Total                     | 5605500455
I do have more drops though (2.9-3%). Looking closes at this i see that one particular thread/worker is doing much more work than the others. Which could simple be a tunnel of some sort lets say. (looking at it with "top -H -p `pidof suricata`")
CN Updated by Cooper Nelson about 7 years ago
@PeterManev
I would think drops might go up if you have a pair of IPs with lots of flows between them; like a NAT to a proxy IP. All flows will end up on the same core using the 'sd' hashing.
As you mentioned, the easiest 'fix' is to enabled 'sd' hashing on the NIC itself. I do not think the older ixgbe cards allow for this.
PM Updated by Peter Manev about 7 years ago
ok - yes - forgot that you are sitting on ixgbe. So in your case - the ixgbe "sd" hashing is not working at all?
CN Updated by Cooper Nelson about 7 years ago
Looking at the source code for the ixgbe in-kernel driver, it appears that 'sd' is not available for TCP due to the firmware implementation of RSS.
GD Updated by Gatewatcher Dev Team about 7 years ago
- File excerpt.pcap excerpt.pcap added
- File http_png.pcap http_png.pcap added
Hi everyone,
Very interesting thread. Thank you.
Unfortunately, we have also been chasing the root cause of a similar (same?) issue for some time now.
Our setup is a bit different than those discussed hitherto.
We use Suricata-4.1.4, without Rust, offloading off, ntuple-filters off, 33 workers pinned to 33 CPU cores, in cluster_flow mode.
We receive the traffic on a single interface.
We do not use RSS (only 1 queue) on an Intel X710 (0x8086, 0x1572). Instead, we are using RPS. We do not use receive-hashing either, because we want to force the hash computation by the kernel instead of offloading it to the NIC.
The main advantage of using RPS is that the code responsible for hashing the incoming trafic is open source, and can be audited and modified if need be (we confirm the issue exists on a vanilla linux 4.20 kernel). Thus, we are eliminating the guessing game of the RSS implementation and the possible driver<->NIC firmware version bugs.
We think that fragmentation has nothing to do with the issue we are facing. RPS does not hash the L4 protocol header if the IP packet is fragmented.
Another reason why we believe fragmentation is not our issue is that in our tests (as in yours, apparently), the defrag parameter has no influence. The defrag parameter controls the use of the PACKET_FANOUT_FLAG_DEFRAG, which, according to the documentation, prevents issues with flow hashing of fragmented packets:
IP fragmentation causes packets from the same flow to have different flow hashes. The flag PACKET_FANOUT_FLAG_DEFRAG, if set, causes packets to be defragmented before fanout is applied, to preserve order even in this case.
We can reproduce our "wrong thread" problem reliably with the attached PCAP (excerpt.pcap). It does not contain any TCP segment with the MF bit set:
```Interestingly, we tried to doctor the IP addresses with Scapy before sharing this pcap, but changing those suppresses the problem! Weirdly, port numbers can be doctored without any consequences, and changing the worker count (and the RPS mask) does not influence the result either.
------------------------------------------------------------------------------------
capture.kernel_packets | Total | 302
decoder.pkts | Total | 302
decoder.bytes | Total | 32000
decoder.ipv4 | Total | 302
decoder.ethernet | Total | 302
decoder.tcp | Total | 302
decoder.vlan | Total | 302
decoder.avg_pkt_size | Total | 105
decoder.max_pkt_size | Total | 1058
flow.tcp | Total | 1
tcp.pkt_on_wrong_thread | Total | 173
flow.spare | Total | 41943040
flow_mgr.rows_checked | Total | 214748364
flow_mgr.rows_skipped | Total | 214748364
tcp.memuse | Total | 7840000000
tcp.reassembly_memuse | Total | 2752512
flow.memuse | Total | 14062662704
Finally, when replaying the second attached pcap (http_png.pcap) on the exact same setup, we have no wrong thread increment, 100% detection rate on a rule that detects the name of the downloaded file and 100% correct file extraction (correct SHA256), meaning that we do not have packet reordering.
Please note that packet reordering are not supposed to happen anyway with RPS, according to the kernel documentation https://www.kernel.org/doc/Documentation/networking/scaling.txt, but we wanted to make sure of it.
RPS scales kernel receive processing across CPUs without introducing reordering.
We hope that this different angle will help the community identifying (one of) the root cause(s) of this issue.
CN Updated by Cooper Nelson about 7 years ago
Armature Technologies wrote:
We think that fragmentation has nothing to do with the issue we are facing. RPS does not hash the L4 protocol header if the IP packet is fragmented.
That is exactly what is causing the problem. If there is a mix of fragmented and unfragmented TCP/IP packets in the same flow, they will get different hashes and most likely end up in different queues. The only way around this is to force hashing on the IP header only (sd ethtool option).
Using the auto-fp runmode (single flow tracker) or forcing a 'sd' hash on the newer 40G NICs has been proven to resolve this issue, so the 'root cause' is very likely due to TCP fragmentation. Assuming you can force 'sd' hashing via RPS that should fix this as well.
I looked at "excerpt.pcap" in Wireshark, there are no SYN/FIN packets in that sample and everything appears to be 'midstream', which might cause issues with the stream tracker. They should all be hashed and load balanced properly, though.
The systems are also on the same /24, so it's very unlikely you are going to see fragmented IP traffic. We only see IP fragmentation on what I call 'dirty' Internet traffic, i.e. distant WAN sites traversing many routers, gateways and firewalls.
GD Updated by Gatewatcher Dev Team about 7 years ago
- File rps_http_png.pcap rps_http_png.pcap added
Hi everyone,
Just a quick follow-up to your answer and our last message:
- you are correct that there is a problem if one hashes the L4 info only if a segment is not fragmented;
- we believe fragmented segments are extremely rare, in general, thanks to MSS clamping and PMTUd;
- we confirm the observations expressed in that thread https://bugzilla.kernel.org/show_bug.cgi?id=120441 ; RPS is not symmetric, at least in Linux 4.20, even when using __skb_get_hash_symmetric...
At the time of testing, RPS was generally symmetric, but some packets consistently returned a different hash when src/dst IP addresses are swapped. The attached PCAP uses such addresses.
We fixed this internally, but we wanted to confirm/disclose that RPS vanilla may trigger every once in a while some tcp.pkt_on_wrong_thread increments.
CN Updated by Cooper Nelson about 7 years ago
Armature Technologies wrote:
- we believe fragmented segments are extremely rare, in general, thanks to MSS clamping and PMTUd;
It really depends on what sort of traffic you are monitoring, on an ISP with lots of "dirty internet" traffic the numbers are extremely high:
$ netstat -es | fgrep reassembl
1272131276 reassemblies required
351718979 packets reassembled ok
528624103 packet reassemblies failed
AH Updated by Andreas Herz almost 7 years ago
I also have some updates:
1. We migrated many systems to cluster_qm and saw huge improvements and nearly all of them got rid of the wrong_thread counter and the ones that still have it only show very small numbers.
2. But we also stumbled upon another issue in scenarios where vlan qinq is used. With Intel X710 (i40e driver) and Intel X520 (ixgbe driver) the result is that always just one queue is used and thus only one core is used on suricata side as well. I tried any settings, driver and firmware updates but it looks like that's an issue with the driver (not the NIC itself). The double vlan (QinQ) doesn't seem to be supported to do the correct hashing and distribution of packets. In those cases I switched back to cluster_flow for now. Another option would be to take care of the outer vlan tag before it reaches the card but I will also report this to the E1000-devel mailinglist, as I saw some people playing around with patched versions that set the correct bits in the hardware to enable double vlan support. If anyone has some insight into that, let me know.
So tl;dr is, cluster_qm is worth a try if you see issues with drops/wrong_thread counter but be cautious if you have a setup with double vlan.
MP Updated by Michal Purzynski almost 7 years ago
To be honest, the X710, cluster_qm with the low entropy hash and the RSS hashing (ATR disabled, nothing in flow rules) has been our production for a while with no issues and no "wrong thread" counters going up, for both Zeek and Suricata.
We "decapsulate" packets to the bone with Arista 7150 and only the inner-most layer is left and we have the RSS hash calculated on the source IP + destination IP pair.
There is no way to have the card calculate the inner hash if vxlan, qinq and similar encapsulations are present. The card's hardware just takes bytes that represent the source and destination IP addresses.
One way we could work-around that, if you do not have a packet broker in front of your sensors, is through some eBPF code that will do hash calculation based on any layers you have.
MP Updated by Michal Purzynski almost 7 years ago
One more thing - what's the hash that RPS uses? There are two hashes and the cluster_flow computation does not update the SKB hash (that might be there from the driver)
GD Updated by Gatewatcher Dev Team almost 7 years ago
Michal Purzynski wrote:
One more thing - what's the hash that RPS uses? There are two hashes and the cluster_flow computation does not update the SKB hash (that might be there from the driver)
In net/core/dev.c, netif_rx_internal uses get_rps_cpu to select the CPU to enqueue the packet to.
get_rps_cpu calls skb_get_hash. Ultimately, the hash was computed by __flow_hash_words in flow_dissector.c, which uses jhash2. We replaced jhash2 by our own algorithm, to fix the symmetric hash issue.
Cooper Nelson wrote:
It really depends on what sort of traffic you are monitoring, on an ISP with lots of "dirty internet" traffic the numbers are extremely high
I can remember an adage saying that everything that is rare can be found by the thousands on the Internet ;) Thanks for your numbers. That's very interesting.
AH Updated by Andreas Herz almost 7 years ago
Michal Purzynski wrote:
To be honest, the X710, cluster_qm with the low entropy hash and the RSS hashing (ATR disabled, nothing in flow rules) has been our production for a while with no issues and no "wrong thread" counters going up, for both Zeek and Suricata.
What do you mean by ATR disabled and nothing in flow rules in detail?
We "decapsulate" packets to the bone with Arista 7150 and only the inner-most layer is left and we have the RSS hash calculated on the source IP + destination IP pair.
I agree that this is the best scenario, it looks much better in scenarios where packet broker or so are configured to take care of some special scenarios.
One way we could work-around that, if you do not have a packet broker in front of your sensors, is through some eBPF code that will do hash calculation based on any layers you have.
I'm looking forward to play more with the eBPF and XPD loadbalancing that Eric introduced and will be improved in 5.0, this might be able to cover such corner cases
DH Updated by David Harmon almost 7 years ago
We have been using cluster_qm, 32 threads, x710/i40e, 32 threads with sdfn/low-entropy hkey balancing for some time now. A few months ago we started seeing this issue on certain sites. Somehow, changing the rx-hash to sd actually increased this counter for us. Any ideas why that might be caused by? This seemed to happen around the time we did a kernel upgrade to 4.15, our driver and firmware are up to date for that kernel tree (i40e: 2.1.14-k, fw 18.8.9). We're on 4.1.4 suricata. It also seems like the wrong-thread counter spikes on restarts, if that behavior helps distinguish this...
VJ Updated by Victor Julien almost 7 years ago
- Related to Bug #3158: 'wrong thread' tracking inaccurate for bridging IPS modes added
EL Updated by Eric Leblond almost 7 years ago
Found a corner case when reading Linux kernel git history: https://lore.kernel.org/patchwork/patch/1051359/
If interfaces get down and up then the sockets will be reordered (for Linux before 5.1) resulting in a big burst of wrong thread occurrences.
MP Updated by Michal Purzynski almost 7 years ago
What do you mean by ATR disabled and nothing in flow rules in detail?
ATR is Intel's Application Targeted Routing, a mechanism that (by sampling SYN packets and every Nth packket) tries to guess where does the application that will consume a packet that just arrived live to improve cache hits.
ATR is useless for us and one can disable it with priv flags (see it for yourself)
ethtool --show-priv-flags enp17s0f0
or by enabling ntuple "too perfect filters"
/usr/bin/ethtool -K enp18s0f0 ntuple on
If PF (=perfect filters) are enabled ATR stays disabled, because all it does it is automatically inserts rules into the PF engine.
One way we could work-around that, if you do not have a packet broker in front of your sensors, is through some eBPF code that will do hash calculation based on any layers you have.
I'm looking forward to play more with the eBPF and XPD loadbalancing that Eric introduced and will be improved in 5.0, this might be able to cover such corner cases
There is one more thing :)
Not sure why we're even discussing RPS here. It's not used by default, unless you enabled it.
Yes, the cluster_flow hashing uses the same (??) hashing as RPS but that's a pure coincidence and it might change in the future. I would say that's kind of by accident the trick with changing the Linux kernel hash works ;)
What I do not understand is why I'm getting packets on the wrong thread with cluster_flow - either the reassembly code that should be hit before the af_packet hash is not hit correctly (there's a parameter that Eric's code uses) or the hash upstream is broken.
As a side effects I do not see problems with IPv6 traffic being hashed on the wrong thread with cluster_qm and RSS - and I did with cluster_flow.
Run this for a while
VJ Updated by Victor Julien over 6 years ago
- Related to Feature #3319: on 'wrong thread' reinject packets to correct thread added
PM Updated by Peter Manev over 6 years ago
Another way of pinpointing locally what is causing the "wrong thread" counters to increase can be enabling only that rule https://github.com/OISF/suricata/blob/master/rules/stream-events.rules#L92 for a while and see if a pattern can be found. For example is it the same src/dest IP always , or some sort of a tunnel or a specific proto/port combo.
CN Updated by Cooper Nelson over 6 years ago
Michal Purzynski wrote in #note-101:
What I do not understand is why I'm getting packets on the wrong thread with cluster_flow - either the reassembly code that should be hit before the af_packet hash is not hit correctly (there's a parameter that Eric's code uses) or the hash upstream is broken.
I have a theory about this for the ixgbe driver/cards at least. While the 'packet' man page says the following:
causes packets from the same flow to have different flowFanout modes can take additional options. IP fragmentation
hashes. The flag PACKET_FANOUT_FLAG_DEFRAG, if set, causes
packets to be defragmented before fanout is applied, to pre‐
serve order even in this case.
... I think this applies only to a fanout process that occurs entirely in software within the linux kernel. On the ixgbe cards, the hash and fanout is done in hardware. However, since the cards cannot reassemble packets they are delivered to the 'wrong' receive queue and tagged with an incorrect hash for the relevant TCP flow. It appears that the linux kernel does reassemble the packets within the AF_PACKET queue, however it either does not update the hash or the RSS queue number is influencing the cluster_flow hash in some way. So yes, it appears the upstream hash is broken in hardware and there isn't anything we can do about on those cards, short of modifying suricata to ignore the RSS hash entirely.
As a side effects I do not see problems with IPv6 traffic being hashed on the wrong thread with cluster_qm and RSS - and I did with cluster_flow.
This is interesting, as IPv6 routers will not fragment IPv6 packets by design (it is in the protocol spec). There is an allowance for clients and servers to fragment packets, however in practice I have not observed that. So there may be something else going on with cluster_flow.
CN Updated by Cooper Nelson over 6 years ago
@Peter Manev
Hey Peter, could you do me a favor on your test rig?
Could you run a test with 'sdfn' flow hashing, one RSS queue and cluster_flow? And let me know if you still see tcp.pkt_on_wrong_thread incrementing?
PM Updated by Peter Manev over 6 years ago
Hi Cooper,
Sorry for the delay in my response was at a conference.
Yes let me try that one out and see. I remember I tried it out before - https://redmine.openinfosecfoundation.org/issues/2725#note-16
but it is good to repeat that process with X/XL710 and see if it makes any diff with or without sd/sdfn.
CN Updated by Cooper Nelson over 6 years ago
Hi Peter,
My theory is that even with 1 RSS queue and hashing disabled, the 'sdfn' RX hash is still generated in hardware by the NIC and is influencing cluster_flow hash in some way. If possible I would really like to see an update to cluster_flow to allow a user defined hashing parameter that complete overrides the kernel one.
PM Updated by Peter Manev over 6 years ago
I played with the settings again a bit.
Using 5.19 kernel , Buster and diff Intel version drivers. (need to test the latest one and will update accordingly)
So that table still stands correct - even with 1 RSS queue there is still "wrong thread" counters.
I tried locking the problem via triggering that rule - https://github.com/OISF/suricata/blob/master/rules/stream-events.rules#L92 and then trying to tcpdump the IP pair to see if i can come up with something. So far no luck - will keep at it if something pops up.
Can you try something similar for a test?
PM Updated by Peter Manev over 6 years ago
Went a bit over my head - it should read 4.19 kernel ...not 5.19 :)
CN Updated by Cooper Nelson over 6 years ago
Peter Manev wrote in #note-109:
Can you try something similar for a test?
No sorry, I'm on an old Piledriver system so no DCA. I need 8 cores per 10Gig NIC.
PM Updated by Peter Manev over 6 years ago
Enabled the anomaly logs in suri as well. (https://github.com/OISF/suricata/blob/master/suricata.yaml.in#L168)
It seems a lot of complains about gre.
Can you plz confirm if you see something similar with respect to gre ?
1758630 decoder.gre.version0_flags
1273177 decoder.gre.version0_recur
 665724 decoder.ppp.wrong_type
 270690 decoder.ipv6.data_after_none_header
  72688 INVALID_SSL_RECORD
  26519 INVALID_HANDSHAKE_MESSAGE
  23969 weak_crypto_dh
  18902 NO_SERVER_WELCOME_MESSAGE
  18044 REQUEST_BODY_UNEXPECTED
  16919 weak_crypto_prf
  14389 weak_crypto_auth
  12821 INVALID_REPLY
  10584 ABNORMAL_CE_HEADER
  10219 DATA_COMMAND_REJECTED
   9943 APPLAYER_DETECT_PROTOCOL_ONLY_ONE_DIRECTION
PM Updated by Peter Manev over 6 years ago
A cleaned up version of the decoder anomaly output
2413323 decoder.gre.version0_flags
2240257 decoder.ppp.wrong_type
1630403 decoder.gre.version0_recur
 433588 decoder.ipv6.data_after_none_header
  15861 decoder.icmpv4.unknown_code
   7022 decoder.ipv6.unknown_next_header
   7014 decoder.ppp.unsup_proto
   1264 decoder.tcp.invalid_optlen
   1072 decoder.tcp.opt_invalid_len
    555 decoder.icmpv4.ipv4_unknown_ver
    202 decoder.ipv6.exthdr_useless_fh
    195 decoder.ipv4.frag_overlap
    177 decoder.ipv4.opt_pad_required
    161 decoder.tcp.hlen_too_small
    122 decoder.udp.pkt_too_small
     86 decoder.ipv6.zero_len_padn
     21 decoder.icmpv4.unknown_type
     10 decoder.udp.hlen_invalid
      2 decoder.ipv6.icmpv4
      1 decoder.ipv6.ipv4_in_ipv6_wrong_version
      1 decoder.ipv6.fh_non_zero_reserved_field
PM Updated by Peter Manev over 6 years ago
Info update-
These anomaly events that I was looking at on some boxes - are not related to the wrong threads counters.
2413323 decoder.gre.version0_flags
2240257 decoder.ppp.wrong_type
1630403 decoder.gre.version0_recur
PM Updated by Peter Manev over 6 years ago
Update.
Running for cpl weeks now on one of the test boxes on live traffic without any wrong thread counters increasing, actually 0.
Basically running on 4.19 kernel , AFPv3,xdp, cluster_qm , 20-30Gbps
This is the nic config:
suricata  -V
This is Suricata version 6.0.0-dev (edcb784f1 2020-04-07)

ethtool -i ens2
driver: i40e
version: 2.11.21
firmware-version: 5.05 0x8000291e 1.1313.0
expansion-rom-version:
bus-info: 0000:5e:00.0
supports-statistics: yes
supports-test: yes
supports-eeprom-access: yes
supports-register-dump: yes
supports-priv-flags: yes
This is the exact config and tune cmd lines i've used
rmmod i40e && modprobe i40e
ifconfig ens2 down
/usr/local/sbin/ethtool -L ens2 combined 40
/usr/local/sbin/ethtool -K ens2 rxhash on
/usr/local/sbin/ethtool -K ens2 ntuple on
ifconfig ens2 up
/opt/i40e/i40e-2.11.21/scripts/set_irq_affinity local ens2
/usr/local/sbin/ethtool -X ens2 hkey 6D:5A:6D:5A:6D:5A:6D:5A:6D:5A:6D:5A:6D:5A:6D:5A:6D:5A:6D:5A:6D:5A:6D:5A:6D:5A:6D:5A:6D:5A:6D:5A:6D:5A:6D:5A:6D:5A:6D:5A:6D:5A:6D:5A:6D:5A:6D:5A:6D:5A:6D:5A equal 40
/usr/local/sbin/ethtool -A ens2 rx off tx off
/usr/local/sbin/ethtool -C ens2 adaptive-rx off adaptive-tx off rx-usecs 125
/usr/local/sbin/ethtool -G ens2 rx 1024
ip link set ens2 promisc on arp off up
echo 1 > /proc/sys/net/ipv6/conf/ens2/disable_ipv6
/usr/local/sbin/ethtool -x ens2
/usr/local/sbin/ethtool -n ens2
for i in rx tx tso ufo gso gro lro tx nocache copy sg txvlan rxvlan; do        echo " /usr/local/sbin/ethtool -K ens2 $i off 2>&1 > /dev/null; ";        /usr/local/sbin/ethtool -K ens2 $i off 2>&1 > /dev/null; done
for proto in tcp4 udp4 tcp6 udp6; do        echo "/usr/local/sbin/ethtool -N ens2 rx-flow-hash $proto sd";        /usr/local/sbin/ethtool -N ens2 rx-flow-hash $proto sd; done
AH Updated by Andreas Herz over 6 years ago
Did you compare sd vs sdfn if it has any effect and would be interesting to see as well if it's just not one interface but more.
PM Updated by Peter Manev over 6 years ago
Yes, they come back "clean" :)
Can you try to reproduce as well please ?
PM Updated by Peter Manev about 6 years ago
@Victor - I have also tried the Teredo section changes to set it to any to try to resurface the issue again - had no effect for a few days running now.
CN Updated by Cooper Nelson about 6 years ago
Peter Manev wrote in #note-116:
Yes, they come back "clean" :)
That is very interesting, I wonder if enabling XDP resolves the issue? I would expect sdfn to still result in the counter incrementing on that deployment as everything else is the same as your prior runs.
PM Updated by Peter Manev about 6 years ago
So after some back and forths I've been able to pinpoint something:
Using the same setup/exact same way as described here - https://redmine.openinfosecfoundation.org/issues/2725#note-114
In order to illustrate it better I was using a "port 443" bpfilter on the command line
No wrong counters using port 443 only and "cluster_qm"
capture.kernel_packets                        | Total                     | 11626852132
flow_bypassed.local_pkts                      | Total                     | 4347464063
flow_bypassed.local_bytes                     | Total                     | 4707128674896
flow_bypassed.local_capture_pkts              | Total                     | 653912588
flow_bypassed.local_capture_bytes             | Total                     | 709817921297
flow_mgr.bypassed_pruned                      | Total                     | 465935
flow.spare                                    | Total                     | 80042048
flow_bypassed.closed                          | Total                     | 74007
capture.kernel_packets                        | Total                     | 11670571383
flow_bypassed.local_pkts                      | Total                     | 4366991175
flow_bypassed.local_bytes                     | Total                     | 4727677934446
flow_bypassed.local_capture_pkts              | Total                     | 654153084
flow_bypassed.local_capture_bytes             | Total                     | 710073282858
flow_mgr.bypassed_pruned                      | Total                     | 467780
flow.spare                                    | Total                     | 80042508
flow_bypassed.closed                          | Total                     | 74069

  suricata -vvv --af-packet -S "/opt/rules/*.rules" -c /etc/suricata/suricata.yaml --pidfile=/var/run/suricata.pid  port 443
[39603] 30/4/2020 -- 12:31:47 - (suricata.c:1066) <Notice> (LogVersion) -- This is Suricata version 6.0.0-dev (690bd1437 2020-04-29) running in SYSTEM mode
...
...
[49915] 30/4/2020 -- 14:40:57 - (source-af-packet.c:2833) <Perf> (ReceiveAFPThreadExitStats) -- (W#40-ens2) Kernel: Packets 341572991, dropped 0
[39603] 30/4/2020 -- 14:40:57 - (counters.c:855) <Info> (StatsLogSummary) -- Alerts: 1166332
[39603] 30/4/2020 -- 14:41:02 - (ippair.c:294) <Perf> (IPPairPrintStats) -- ippair memory usage: 414144 bytes, maximum: 16777216
[39603] 30/4/2020 -- 14:41:04 - (host.c:299) <Perf> (HostPrintStats) -- host memory usage: 2331112 bytes, maximum: 33554432
[39603] 30/4/2020 -- 14:41:05 - (detect-engine-build.c:1716) <Info> (SigAddressCleanupStage1) -- cleaning up signature grouping structure... complete
[39603] 30/4/2020 -- 14:41:05 - (util-device.c:360) <Notice> (LiveDeviceListClean) -- Stats for 'ens2':  pkts: 11739174946, drop: 28109 (0.00%), invalid chksum: 0
[39603] 30/4/2020 -- 14:41:05 - (util-mpm-hs.c:1081) <Perf> (MpmHSGlobalCleanup) -- Cleaning up Hyperscan global scratch
[39603] 30/4/2020 -- 14:41:05 - (util-mpm-hs.c:1089) <Perf> (MpmHSGlobalCleanup) -- Clearing Hyperscan database cache
All seems to be good, no wrong counters.
Same settings - the only change is that - afp is using "cluster_flow" this time -
We get wrong counters
capture.kernel_packets                        | Total                     | 4678233132
stream.wrong_thread                           | Total                     | 252703
flow_bypassed.local_pkts                      | Total                     | 1328151092
flow_bypassed.local_bytes                     | Total                     | 1437795890055
flow_bypassed.local_capture_pkts              | Total                     | 382218845
flow_bypassed.local_capture_bytes             | Total                     | 415302118338
tcp.pkt_on_wrong_thread                       | Total                     | 17225801
flow_mgr.bypassed_pruned                      | Total                     | 179339
flow.spare                                    | Total                     | 80039903
flow_bypassed.closed                          | Total                     | 45875

  suricata -vvv --af-packet -S "/opt/rules/*.rules" -c /etc/suricata/suricata.yaml --pidfile=/var/run/suricata.pid  port 443
[82047] 30/4/2020 -- 15:03:19 - (suricata.c:1066) <Notice> (LogVersion) -- This is Suricata version 6.0.0-dev (690bd1437 2020-04-29) running in SYSTEM mode
...
...
[82047] 30/4/2020 -- 15:58:35 - (counters.c:855) <Info> (StatsLogSummary) -- Alerts: 452874
[82047] 30/4/2020 -- 15:58:38 - (ippair.c:294) <Perf> (IPPairPrintStats) -- ippair memory usage: 414144 bytes, maximum: 16777216
[82047] 30/4/2020 -- 15:58:41 - (host.c:299) <Perf> (HostPrintStats) -- host memory usage: 2084272 bytes, maximum: 33554432
[82047] 30/4/2020 -- 15:58:42 - (detect-engine-build.c:1716) <Info> (SigAddressCleanupStage1) -- cleaning up signature grouping structure... complete
[82047] 30/4/2020 -- 15:58:42 - (util-device.c:360) <Notice> (LiveDeviceListClean) -- Stats for 'ens2':  pkts: 4704208221, drop: 0 (0.00%), invalid chksum: 0
[82047] 30/4/2020 -- 15:58:42 - (util-mpm-hs.c:1081) <Perf> (MpmHSGlobalCleanup) -- Cleaning up Hyperscan global scratch
[82047] 30/4/2020 -- 15:58:42 - (util-mpm-hs.c:1089) <Perf> (MpmHSGlobalCleanup) -- Clearing Hyperscan database cache
PM Updated by Peter Manev about 6 years ago
Any feedback on the above here is much appreciated.
AH Updated by Andreas Herz about 6 years ago
I can confirm that in most cases the issue is gone when cluster_qm is used with your recommendation, only slight differences as long as just one interface is used. As soon as a second interface is used the counter is back. If I look into the ethtool stats for the queues and also the irq affinity counter I don't see any hint that the assignment of flows is wrong. If I add the rule I also don't see any suspicious hints.
PM Updated by Peter Manev about 6 years ago
Thanks for the feedback. I will look closer into 2 int setup test.
Are there any other cases besides the 2 interface configs where this happens in your setup?
AH Updated by Andreas Herz about 6 years ago
So what I can tell from looking at the stats from around 100 machines:
1. It's still an issue when 2 interfaces are used even though the recommendations for the cluster_qm are set, irq affinity is set as well as the affinity. In nearly all cases the counter is still there but it varies a lot between very minor numbers (like 10 of 1000000 packets) or 10000 packets per sec on the wrong_thread. Also it's sometimes steady and sometimes just spikes.
2. It's nearly gone at all when just 1 interface is used, a minor number is left with a rather visible wrong_thread counter although no specific issue was seen. Might be worth to do a deep dive into the traffic.
3. It's still an issue with NICs that don't support all features necessary, but that is rather expected to be problematic.
I might start to test if I can extend https://github.com/google/gopacket/blob/master/afpacket/afpacket.go to write a small tool that logs what traffic is in which queue and ends up in which cpu. I guess in the end it's some sort of traffic that causes that issue in the 1 interface scenarios. With the 2 interfaces I suspect that more finetuning is necessary. The queues seen in ethtool looks evenly distributed but doesn't mean that we end up with some traffic in wrong queues.
PM Updated by Peter Manev about 6 years ago
Thank you for the update.
Couple of questions:
wrt 1 - I dont understand this " very minor numbers (like 10 of 1000000 packets) or 10000 packets per sec on the wrong_thread." Is it 10 counters per million packets or is it 10k wrong counters per second?
wrt 2 - Is that on one specfific NIc/Sensor ?
wrt 3 - what NICs/features do you refer to ?
In all the cases - are all those Intel NICs i40e or different ones too? 1/10Gbps port mix?
On my side in the tests , going back to 5.0.0 - still see very small wrong_thread counters - negligible - like 3-100 counters on a billion packets.
AH Updated by Andreas Herz about 6 years ago
Peter Manev wrote in #note-124:
wrt 1 - I dont understand this " very minor numbers (like 10 of 1000000 packets) or 10000 packets per sec on the wrong_thread." Is it 10 counters per million packets or is it 10k wrong counters per second?
Some are very low, wrong_thread counter at 10 or 20 while decoder.pkts over 1million. But sometimes the wrong_thread counter is rather high increasing by 10000 in some seconds.
wrt 2 - Is that on one specfific NIc/Sensor ?
It's specific to traffic I would say. Same hardware, same OS, same configuration etc. so the only variable is the traffic itself. One I found seems to be related to Cisco Fabric Path, when I add bpf-filter: "not ether proto 0x8903" to the interface afpacket section it's currently gone. When I remove the filter it's back again. This fits in the discussion that there is some sort of traffic that doesn't play by the rules (or triggers a bug at some point, either NIC, driver, firmware, kernel, suricata).
wrt 3 - what NICs/features do you refer to ?
($1 interface name, queues 18 or 22 depending on cpu, specific isolated cores in $CORES)
ethtool -L "$1" combined $QUEUES
ethtool -X "$1" hkey 6D:5A:6D:5A:6D:5A:6D:.... equal $QUEUES
ethtool -K "$1" rxhash on
ethtool -K "$1" ntuple on
for i in rx tx tso gso gro lro tx-nocache-copy sg txvlan rxvlan; do ethtool -K "$1" $i off; done
for proto in tcp4 udp4 tcp6 udp6; do ethtool -N "$1" rx-flow-hash $proto sdfn; done
ethtool -C "$1" adaptive-rx off rx-usecs 62
ethtool -G "$1" rx 1024
/usr/local/bin/set_irq_affinity $CORES $1
And in Suricata:
af-packet:
  - interface: enp94s0f1
    cluster-id: 98
    cluster-type: cluster_qm
    threads: 18
    defrag: yes
    use-mmap: yes
    mmap-locked: yes
    tpacket-v3: yes
    rollover: no
    use-emergency-flush: yes
    ring-size: 200000
    block-size: 4194304
In all the cases - are all those Intel NICs i40e or different ones too? 1/10Gbps port mix?
driver: i40e
version: 2.8.20-k
firmware-version: 7.00 0x80004cd3 1.2154.0
Either just one 10GE port used (which in most cases is fine) or two 10GE Ports used (which still is an issue) on the Intel X710.
I excluded more complex setups where additional nics come into play for now.
PM Updated by Peter Manev about 6 years ago
One thing is certain in my view now - it is not config related.
We have experienced similar symptoms on different machines/suri versions/driver versions/kernels.
What i just observed on the same machine that I had no wrong counters for weeks (and hed made no config changes for a while in terms of yaml/drivers etc..), they started come up again but in bursts and without any specific repetitiveness while all other Suricata counters are normal.
I've set up a filter for ether proto 0x8903 to try to dump some packets, currently there are none but also the wrong counters are not increasing either.
I think regular troubleshooting approach should highlight if any this is the only proto to blame or there are others (start filtering per port/proto and see where it starts coming up)
capture.kernel_packets                        | Total                     | 898392521619
capture.kernel_drops                          | Total                     | 5811803664
stream.wrong_thread                           | Total                     | 16911
flow_bypassed.local_pkts                      | Total                     | 486302566898
flow_bypassed.local_bytes                     | Total                     | 566256714906670
flow_bypassed.local_capture_pkts              | Total                     | 160330312
flow_bypassed.local_capture_bytes             | Total                     | 186621832217
tcp.pkt_on_wrong_thread                       | Total                     | 533848065
detect.alert                                  | Total                     | 203037817
flow_mgr.bypassed_pruned                      | Total                     | 541885388
flow.spare                                    | Total                     | 80505875
flow.emerg_mode_entered                       | Total                     | 8
flow.emerg_mode_over                          | Total                     | 8
flow_bypassed.closed                          | Total                     | 301176

capture.kernel_packets                        | Total                     | 898441128326
capture.kernel_drops                          | Total                     | 5811803664
stream.wrong_thread                           | Total                     | 16911
flow_bypassed.local_pkts                      | Total                     | 486329405285
flow_bypassed.local_bytes                     | Total                     | 566286352052710
flow_bypassed.local_capture_pkts              | Total                     | 160330312
flow_bypassed.local_capture_bytes             | Total                     | 186621832217
tcp.pkt_on_wrong_thread                       | Total                     | 533848065
detect.alert                                  | Total                     | 203050570
flow_mgr.bypassed_pruned                      | Total                     | 541916839
flow.spare                                    | Total                     | 80493431
flow.emerg_mode_entered                       | Total                     | 8
flow.emerg_mode_over                          | Total                     | 8
flow_bypassed.closed                          | Total                     | 301176
PM Updated by Peter Manev about 6 years ago
So after good few days of back and forth and diff runs here is my observation:
suricata -v --af-packet -S /opt/rules/*.rules -c /etc/suricata/suricata-testalloutputs-2-interfaces-v1.yaml --pidfile=/var/run/suricata.pid not ether proto 0x8903
...

...
<Info> (AFPSetBPFFilter) -- Using BPF 'not ether proto 0x8903' on iface 'ens4np0np0'
...
..
I still get wrong packet/stream counters
Also -
Without making any config changes (yaml/drivers/OS/rules) , it seems the wrong thread counters come and go in "batches" and are not constant.
CN Updated by Cooper Nelson about 6 years ago
At this point it might make sense to have the devs cook up a git branch that will dump the relevant packets from both queues that are triggering the counter.
PM Updated by Peter Manev about 6 years ago
I managed to create away of making the wrong counters appear at will in the lab.
It is a bit "fake" though as the NIC's forced to use a load balancer (default CRC) that does not produce not symmetric and that results in lots of wrong thread counters. It is a way of testing cluster_flow/and the counter generation. Digging at it to see if a related case could be produced for the QA/investigation.
PM Updated by Peter Manev about 6 years ago
I have finally a reproducible set up that I can trigger at will wrong threads counters by way if changing cluster_qm to cluster_flow (AFPv3) while replaying the same pcap.
The set up is exactly the same in either case above , with just changing the "cluster" method. In both cases the NIC is Intel / i40e driver, 710, 10Gbps
Will share the details/pcaps privately.
VP Updated by Vito Piserchia almost 5 years ago
Hi all, there is any news on this issue?
AH Updated by Andreas Herz almost 5 years ago
There has been mostly research on this topic, but no easy fix yet. What would help if we get all the details of a setup where it happens and the traffic.
So for example we have seen same setup, same hardware with two different types of traffic show different results. In one case the flow hash algorithm was not perfectly working on the NIC (no solution so far) with encapsulated traffic and thus the traffic ended up in different threads.
In aonther scenario one part of the traffic was seen on interface A and the other on interface B, thus they ended up in different threads although they are of the same flow. Right now this can only be solved if the traffic is merged before hitting the interface.
SC Updated by Sean Cloherty almost 5 years ago
I am using 6.0.3 on both CentOS 7 and 8 so I will try to collect some updated info for each.
SC Updated by Sean Cloherty over 4 years ago
Sean Cloherty wrote in #note-133:
I am using 6.0.3 on both CentOS 7 and 8 so I will try to collect some updated info for each.
Sorry for the late update. I've not seen it on any of them in the last 60 days worth of logs.
BB Updated by bneoshvow bneoshvow over 4 years ago
- File 62.gif added
AH Updated by Andreas Herz over 4 years ago
- Tracker changed from Support to Optimization
PA Updated by Philippe Antoine over 3 years ago
- Related to Task #5488: Suricon 2022 brainstorm added
PA Updated by Philippe Antoine over 3 years ago
- Related to Bug #5270: Flow hash table collision and flow state corruption between different capture interfaces added
PA Updated by Philippe Antoine over 3 years ago
Reasons : IPv4 fragmentation, tunneling protocols (multiple layers GRE/ERSPAN), different interfaces for capture
Mix of encapsulated and unencapsulated traffic for the same flow
More observability where it went wrong : numa node ?
VJ Updated by Victor Julien over 3 years ago
- Related to Feature #5673: capture: option to decapsulate everything first added
PA Updated by Philippe Antoine about 3 years ago
- Target version set to TBD
Updated by Anonymous almost 3 years ago
- File 178.gif added
VJ Updated by Victor Julien almost 3 years ago
- File deleted (
62.gif)
VJ Updated by Victor Julien almost 3 years ago
- File deleted (
178.gif)
PA Updated by Philippe Antoine over 2 years ago
Another reason: icmpv4 packet cf
ICMPV4_DEST_UNREACH_IS_VALID. in flow-hash.c
No, because FLOW_WRONG_THREAD happens only for TCP packets
VJ Updated by Victor Julien over 2 years ago
- Related to Bug #6394: Sudden increase in capture.kernel_drops and tcp.pkt_on_wrong_thread after upgrading to 6.0.14 added
Updated by Anonymous about 2 years ago
· Edited
- File 79.gif added
AH Updated by Andreas Herz about 2 years ago
- File deleted (
79.gif)
Updated by Anonymous about 2 years ago
· Edited
- File 77.gif added
VJ Updated by Victor Julien about 2 years ago
- File deleted (
77.gif)
Updated by Anonymous about 2 years ago
· Edited
- File 247.gif added
VJ Updated by Victor Julien about 2 years ago
- File deleted (
247.gif)
Updated by Anonymous about 2 years ago
· Edited
- File 228.gif added
VJ Updated by Victor Julien about 2 years ago
- File deleted (
228.gif)
Updated by Anonymous about 2 years ago
· Edited
- File 15.gif added
PM Updated by Peter Manev about 2 years ago
- File deleted (
15.gif)
Updated by Anonymous about 2 years ago
· Edited
- File 258.gif added
JI Updated by Jason Ish about 2 years ago
- File deleted (
258.gif)
Updated by Anonymous about 2 years ago
· Edited
- File 0.gif added
AH Updated by Andreas Herz about 2 years ago
- File deleted (
0.gif)
Updated by Anonymous about 2 years ago
· Edited
- File 45.gif added
VJ Updated by Victor Julien about 2 years ago
- File deleted (
45.gif)
Updated by Anonymous about 2 years ago
· Edited
- File 242.gif added
VJ Updated by Victor Julien about 2 years ago
- File deleted (
242.gif)
Updated by Anonymous about 2 years ago
· Edited
- File 254.gif added
VJ Updated by Victor Julien about 2 years ago
- File deleted (
254.gif)
Updated by Anonymous almost 2 years ago
· Edited
- File 13.gif added
VJ Updated by Victor Julien almost 2 years ago
- File deleted (
13.gif)
Updated by Anonymous almost 2 years ago
· Edited
- File 258.gif added
VJ Updated by Victor Julien almost 2 years ago
- File deleted (
258.gif)
Updated by Anonymous almost 2 years ago
· Edited
- File 34.gif added
VJ Updated by Victor Julien almost 2 years ago
- File deleted (
34.gif)
Updated by Anonymous over 1 year ago
· Edited
- File 82.gif added
Updated by Anonymous over 1 year ago
· Edited
- File 11.gif added
VJ Updated by Victor Julien over 1 year ago
- File deleted (
82.gif)
VJ Updated by Victor Julien over 1 year ago
- File deleted (
11.gif)
Updated by Anonymous over 1 year ago
· Edited
- File 271.gif added
PM Updated by Peter Manev over 1 year ago
- File deleted (
271.gif)
Updated by Anonymous over 1 year ago
· Edited
- File 206.gif added
Updated by Anonymous over 1 year ago
· Edited
- File 256.gif added
Updated by Anonymous over 1 year ago
· Edited
- File 259.gif added
VJ Updated by Victor Julien over 1 year ago
- File deleted (
206.gif)
VJ Updated by Victor Julien over 1 year ago
- File deleted (
256.gif)
VJ Updated by Victor Julien over 1 year ago
- File deleted (
259.gif)
Updated by Anonymous over 1 year ago
· Edited
- File 127.gif added
Updated by Anonymous over 1 year ago
· Edited
- File 157.gif added
VJ Updated by Victor Julien over 1 year ago
- File deleted (
127.gif)
VJ Updated by Victor Julien over 1 year ago
- File deleted (
157.gif)
Updated by Anonymous about 1 year ago
· Edited
- File pulyssnged.gif added
VJ Updated by Victor Julien about 1 year ago
- File deleted (
pulyssnged.gif)
Updated by Anonymous 11 months ago
· Edited
- File cqloevdorz.gif added
VJ Updated by Victor Julien 11 months ago
- File deleted (
cqloevdorz.gif)